
Fisher_m11
مؤشر
1 عمليات الشراء
الإصدار 1.0، Jul 2025
Windows, Mac
4.0
التقييمات: 1
الوصف
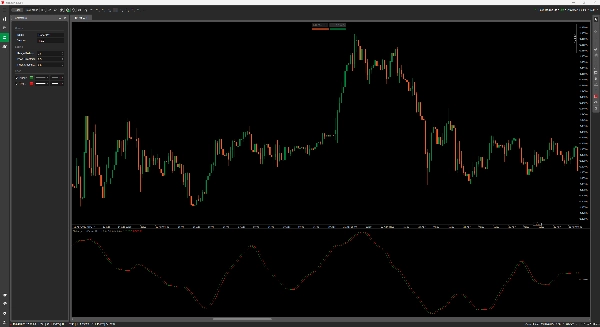
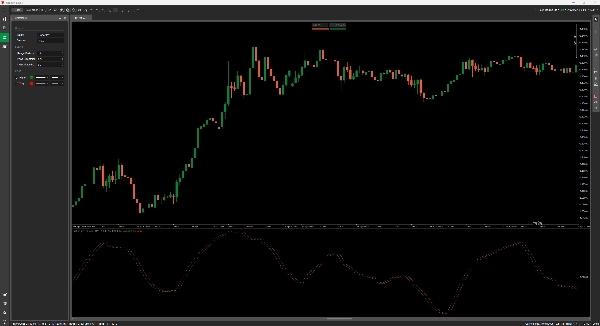
فيشر M11 – حوّل الفوضى إلى دورات
نسخة قوية من تحويل فيشر، يساعدك فيشر M11 على تحديد نقاط الانعطاف و تصفية الضوضاء من خلال تحويل حركة السعر إلى توزيع يشبه التوزيع الغاوسي—مما يعطي إشارات واضحة وقابلة للقراءة في أي سوق.
الميزات:
- إعداد بخطين: فيشر (أخضر) و المُشغّل (أحمر)
- يسلط الضوء على احتمالات انعكاسات الاتجاه و تحولات الزخم
- قابل للتعديل بالكامل:
-
- فترات النطاق: الحساسية للارتفاعات/الانخفاضات
- تمليس السعر: يصفّي حركة السعر المتقلبة
- تمليس المؤشر: يتحكم في تفاعل الإشارة
- يعمل على أي إطار زمني و أي أصل
استخدمه للتأكيد، التوقيت، أو إعدادات الانعكاس المستقلة.
الملخص
ملخص الذكاء الاصطناعي
Fisher M11 is an advanced indicator based on the Fisher Transform designed to identify turning points and filter noise in price data by converting price action into a Gaussian-like distribution. It features a dual-line setup with a Fisher line (green) and a Trigger line (red) to highlight potential trend reversals and momentum shifts. The indicator is fully adjustable, allowing users to customize range periods for sensitivity to highs and lows, price smoothing to reduce choppy movements, and index smoothing to control signal reactivity. Fisher M11 is compatible with any market, asset, and timeframe, making it suitable for use as a confirmation tool, timing aid, or standalone reversal setup.
ملف تعريف المؤشر
تقييمات العملاء
4.0
التقييمات: 1
5 | 0 % | |
4 | 100 % | |
3 | 0 % | |
2 | 0 % | |
1 | 0 % |
تقييمات العملاء
July 23, 2025
A first opinion needs more than one signal. It adds another angle without taking control.
مناقشة
الأسئلة الشائعة
يتم توفير المنتجات المتاحة من خلال cTrader Store، بما في ذلك روبوتات التداول والمؤشرات والإضافات، من قبل مطوري الطرف الثالث وإتاحتها لأغراض الوصول المعلوماتي والفني فقط. cTrader Store ليس وسيطًا ولا يقدم نصائح استثمارية أو توصيات شخصية أو أي ضمان للأداء المستقبلي.


السعر
منذ 03/01/2025
638.03K
حجم التداول
21.34K
الربح بالبيب
15
المبيعات