
HTFBB
مؤشر
1 عمليات الشراء
الإصدار 1.0، Jul 2025
Windows, Mac
5.0
التقييمات: 1
الوصف
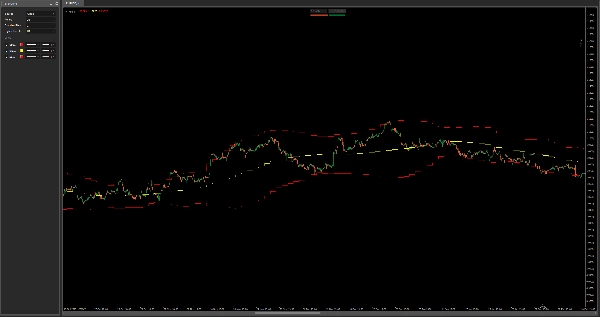
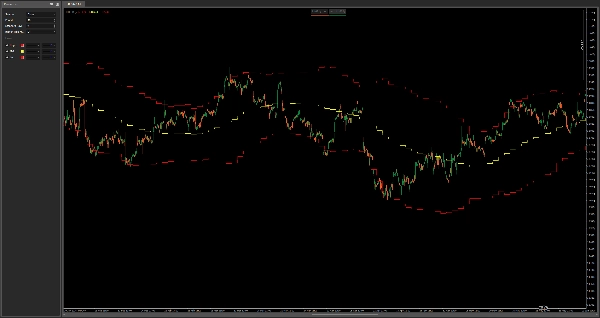
HTF Bollinger Bands – خريطة تقلبات متعددة الأطر الزمنية
يقوم هذا المؤشر برسم أشرطة بولينجر من إطار زمني أعلى على الرسم البياني الحالي الخاص بك، مما يمنحك سياقًا قويًا للتقلب، والارتداد إلى المتوسط، والدعم/المقاومة الديناميكية—كل ذلك دون الحاجة لتغيير الأطر الزمنية.
الميزات:
- يعرض أشرطة بولينجر العلوية والوسطى والسفلية من أي إطار زمني أعلى قابل للاختيار
- ممتاز لتحديد مناطق التوحيد في HTF، ضغط الاختراق، وتراجعات الاتجاه
- مثالي للتداول السريع والدخول خلال اليوم مع وعي بالإطار الزمني الأعلى
- يعمل على جميع الأصول والأطر الزمنية
ادمج مع استراتيجيتك الحالية لتجنب التداول في فخاخ التقلبات والبقاء متوافقًا مع هيكل السعر الكلي.
الملخص
ملف تعريف المؤشر
تقييمات العملاء
5.0
التقييمات: 1
5 | 100 % | |
4 | 0 % | |
3 | 0 % | |
2 | 0 % | |
1 | 0 % |
تقييمات العملاء
July 29, 2025
confusing signals get easier to ignore, but a clean signal can still fail.
مناقشة
الأسئلة الشائعة
يتم توفير المنتجات المتاحة من خلال cTrader Store، بما في ذلك روبوتات التداول والمؤشرات والإضافات، من قبل مطوري الطرف الثالث وإتاحتها لأغراض الوصول المعلوماتي والفني فقط. cTrader Store ليس وسيطًا ولا يقدم نصائح استثمارية أو توصيات شخصية أو أي ضمان للأداء المستقبلي.


السعر
منذ 03/01/2025
638.03K
حجم التداول
21.34K
الربح بالبيب
15
المبيعات