
PriceLevels
مؤشر
4 عمليات الشراء
الإصدار 1.0، Jan 2025
Windows, Mac
5.0
التقييمات: 2
الوصف
الميزات الرئيسية:
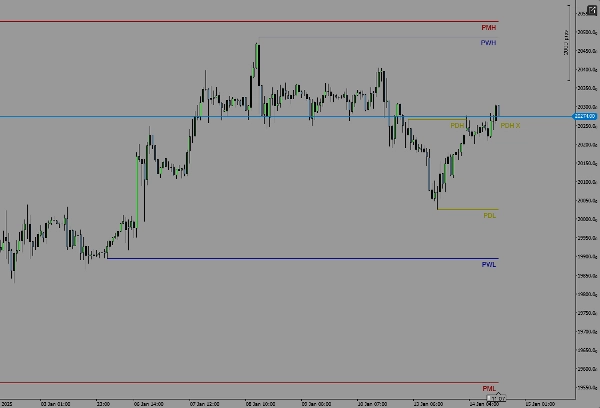
- يعرض مستويات الأعلى والأدنى ليوم أمس.
- يعرض مستويات الأعلى والأدنى للأسبوع الماضي.
- يعرض مستويات الأعلى والأدنى للشهر الماضي.
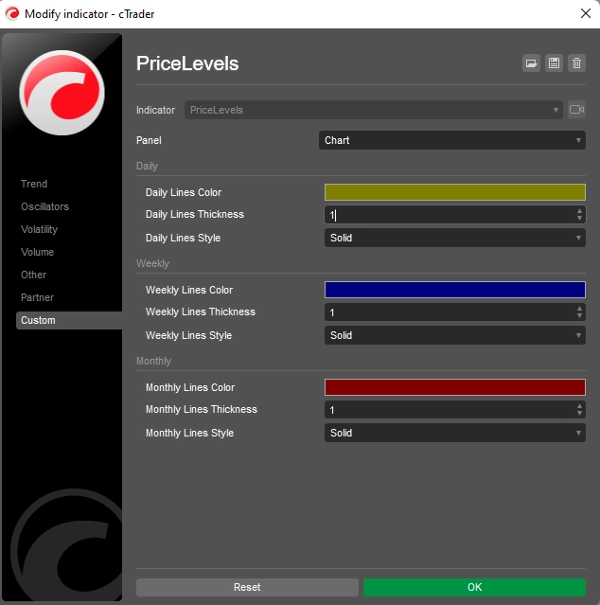
- ألوان وأنماط خطوط قابلة للتخصيص لكل مستوى.
كيف يعمل:
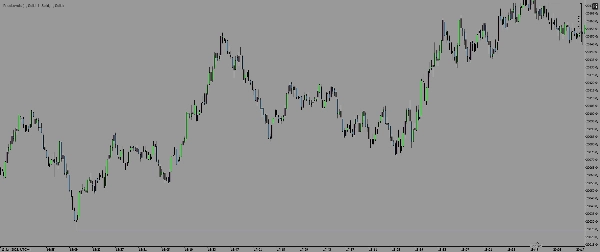
يقوم المؤشر تلقائيًا بحساب أعلى وأدنى الأسعار لليوم السابق، والأسبوع، والشهر بناءً على الإطار الزمني للرسم البياني الخاص بك. ثم يتم رسم هذه المستويات كخطوط أفقية على الرسم البياني، مما يوفر مرجعًا بصريًا واضحًا لحركة السعر التاريخية.
التوافق:
- مصمم لمنصة cTrader فقط.
- يعمل على جميع الأطر الزمنية والأدوات.
إذا كان لديك أي أسئلة أو ملاحظات أو اقتراحات لتحسين، لا تتردد في التواصل! مدخلاتك ذات قيمة عالية وستساعد في جعل هذا المؤشر أفضل.
تداول موفق!
الملخص
ملخص الذكاء الاصطناعي
PriceLevels is an indicator designed for the cTrader platform that automatically calculates and displays key historical price levels on trading charts. It plots the highest and lowest prices from the previous day, last week, and last month as horizontal lines, providing traders with clear visual references for past price action. The indicator supports all timeframes and instruments available on cTrader. Users can customize the colors and line styles for each displayed level to suit their charting preferences. This tool aids in identifying significant support and resistance zones based on recent historical data.
ملف تعريف المؤشر
تقييمات العملاء
5.0
التقييمات: 2
5 | 100 % | |
4 | 0 % | |
3 | 0 % | |
2 | 0 % | |
1 | 0 % |
مناقشة
الأسئلة الشائعة
يتم توفير المنتجات المتاحة من خلال cTrader Store، بما في ذلك روبوتات التداول والمؤشرات والإضافات، من قبل مطوري الطرف الثالث وإتاحتها لأغراض الوصول المعلوماتي والفني فقط. cTrader Store ليس وسيطًا ولا يقدم نصائح استثمارية أو توصيات شخصية أو أي ضمان للأداء المستقبلي.


![شعار "[Stellar Strategies] Inside Bar with Signals"](https://cdn.ctrader.com/image/webp/1d9e8bfa-3b2c-4440-bb37-5856902008a7_30683)


السعر
منذ 05/01/2025
14
المبيعات