
الوصف
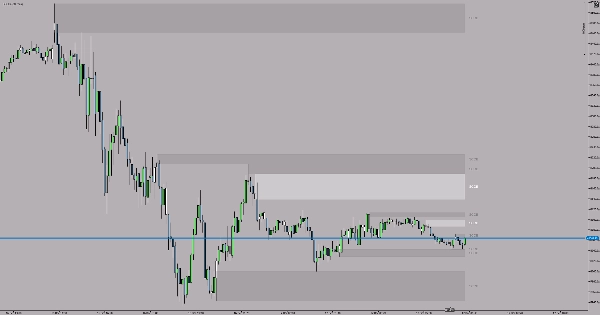
مؤشر SCOB (كتلة الأوامر ذات الشمعة الواحدة) يحدد تلقائيًا ويبرز أنماط كتل الأوامر القوية على الرسم البياني الخاص بك. هذه الأداة البسيطة والفعالة تساعد المتداولين على اكتشاف أنماط الانعكاس الرئيسية التي غالبًا ما تشير إلى نشاط مؤسسي قوي.
ما هو SCOB؟
SCOB هو نمط مكون من ثلاث شموع يكشف عن مناطق انعكاس محتملة:
SCOB صعودي:
- الشمعة الثانية تصنع أدنى سعر أقل من الشمعة الثالثة
- أدنى سعر الشمعة الأولى يبقى فوق أدنى سعر الشمعة الثانية
- الشمعة الأولى تغلق فوق أعلى سعر الشمعة الثانية
- الشمعة الثانية مميزة كمنطقة دعم محتملة
SCOB هبوطي:
- الشمعة الثانية تصنع أعلى سعر أعلى من الشمعة الثالثة
- أعلى سعر الشمعة الأولى يبقى تحت أعلى سعر الشمعة الثانية
- الشمعة الأولى تغلق تحت أدنى سعر الشمعة الثانية
- الشمعة الثانية مميزة كمنطقة مقاومة محتملة
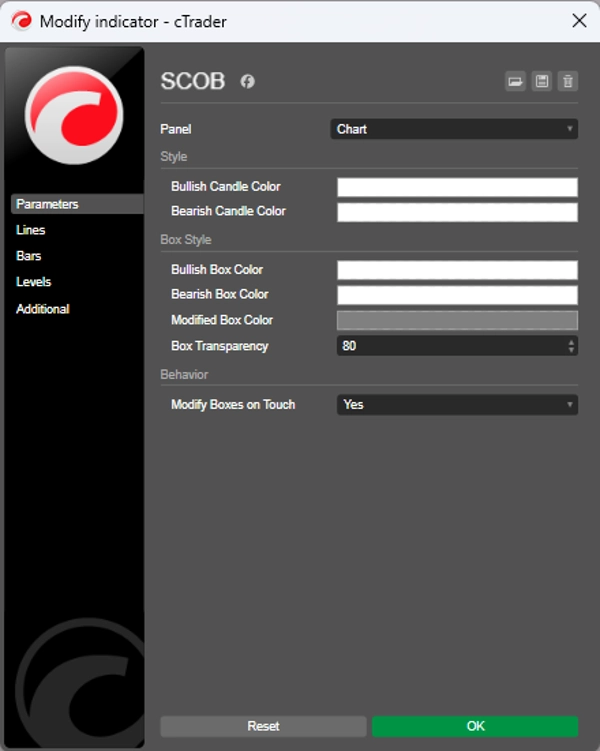
الإعدادات
لون الشمعة الصعودية - اختر لون التمييز لأنماط SCOB الصعودية (الافتراضي: أبيض)
لون الشمعة الهبوطية - اختر لون التمييز لأنماط SCOB الهبوطية (الافتراضي: أصفر)
نصائح الاستخدام
- استخدم أنماط SCOB لتحديد مناطق الدخول المحتملة
- ادمجها مع أدوات التحليل الفني الأخرى للتأكيد
- الشمعة المميزة تمثل مستوى مؤسسي رئيسي
- تداول دائمًا مع الاتجاه لفرص إعدادات أعلى
- يمكن استخدامها على أي إطار زمني بناءً على استراتيجيتك التداولية
- أفضل ممارسة: ضع علامات على أنماط SCOB في الأطر الزمنية الأعلى (H1, H4, يومي) وتداول في اتجاه الاتجاه.
الملخص
ملف تعريف المؤشر
تقييمات العملاء
4.5
التقييمات: 2
5 | 50 % | |
4 | 50 % | |
3 | 0 % | |
2 | 0 % | |
1 | 0 % |
تقييمات العملاء
October 3, 2025
Helps more when the trader avoids forced trades. It should not replace the chart.
مناقشة
الأسئلة الشائعة
BTCUSD
Forex
Indices
EURUSD
Commodities
GBPUSD
Prop
Scalping
SMC
Crypto
Stocks
XAUUSD
NAS100
USDJPY
يتم توفير المنتجات المتاحة من خلال cTrader Store، بما في ذلك روبوتات التداول والمؤشرات والإضافات، من قبل مطوري الطرف الثالث وإتاحتها لأغراض الوصول المعلوماتي والفني فقط. cTrader Store ليس وسيطًا ولا يقدم نصائح استثمارية أو توصيات شخصية أو أي ضمان للأداء المستقبلي.


السعر
منذ 05/01/2025
14
المبيعات