
الوصف
نظرة عامة
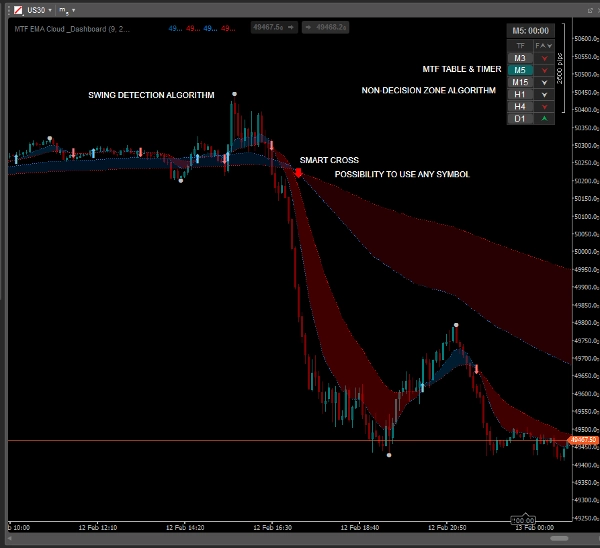
توقف عن التخمين في اتجاه السوق. EMA MTF Cloud & Dashboard هي مجموعة أدوات شاملة لمتابعة الاتجاه مصممة للمتداولين السريع واليومي. تجمع بين سلاسة المتوسطات المتحركة الأسية وقوة تحليل الأطر الزمنية المتعددة، كل ذلك في واجهة رسم بياني نظيفة واحدة.
على عكس المؤشرات القياسية، تتضمن هذه الأداة منطق المنطقة المحايدة الذكية لتصفية الأسواق المتقلبة، مما يوفر عليك الإشارات الخاطئة خلال الفترات المستقرة.
الميزات الرئيسية
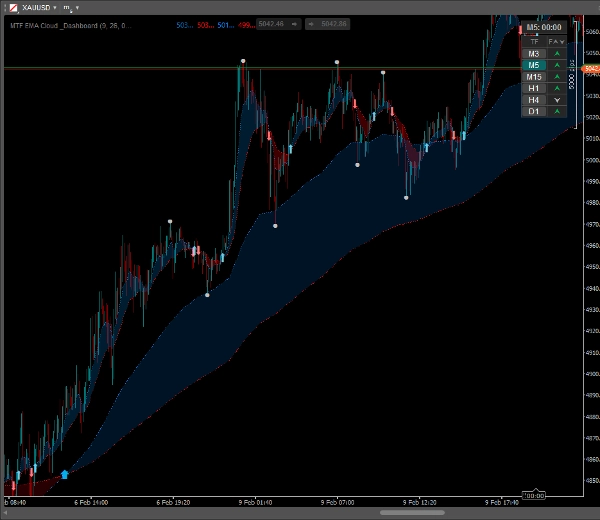
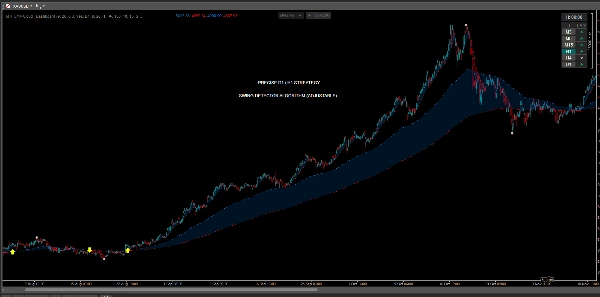
✅ سحب EMA الديناميكية
تصور الاتجاه فورًا. يتم ملء المساحة بين المتوسطات المتحركة السريعة والبطيئة بسحابة نصف شفافة، مما يسهل تحديد قوة الاتجاه ومناطق الدعم/المقاومة المحتملة.
✅ تراكب MTF (الأطر الزمنية المتعددة)
شاهد "الصورة الكبيرة" دون تبديل الرسوم البيانية. عرض المتوسطات المتحركة الأسية للأطر الزمنية الأعلى (مثل H1) مباشرة على الرسم البياني للإطار الزمني الأدنى (مثل M5).
- يشمل سهام تقاطع منفصلة لاتجاه MTF!
✅ لوحة تحكم الاتجاه الذكية
جدول مدمج وقابل للنقر يعرض حالة الاتجاه لـ 6 أطر زمنية (من M3 إلى يومي).
- منطق المنطقة المحايدة: تكتشف اللوحة الأسواق المستقرة (التوحيد) وتعلمها باللون الرمادي/الفضي، مما يساعدك على تجنب الصفقات السيئة.
- تفاعلية: انقر على أي زر إطار زمني في الجدول لتبديل الرسم البياني فورًا.
✅ نقاط القمم والقيعان المتأرجحة
تحدد تلقائيًا القمم والقيعان المحلية المهمة. مثالية لوضع أوامر وقف الخسارة أو تحديد مستويات جني الأرباح بناءً على هيكل السعر الأخير.
✅ إشارات التقاطع المرئية
سهام واضحة وقابلة للتخصيص تظهر بالضبط عندما يعبر EMA السريع EMA البطيء.
- خصص الألوان والأحجام وأنماط الأسهم.
✅ مؤقت الشمعة
مؤقت عد تنازلي مدمج يظهر بالضبط كم من الوقت تبقى حتى إغلاق الشمعة، وهو أمر أساسي لتوقيت دخولك.
كيفية التداول (مثال على الاستراتيجية)
- تحقق من لوحة التحكم: تأكد من تطابق الأطر الزمنية الأعلى (مثل H1، H4) (أخضر/أحمر). تجنب التداول إذا أظهرت "محايد" (رمادي).
- انتظر الإشارة: ابحث عن سهم تقاطع في اتجاه الاتجاه الرئيسي.
- أكد باستخدام حركة السعر: استخدم نقاط "القمم/القيعان المتأرجحة" لتأكيد هيكل السوق.
- ادخل وأدر الصفقة: ادخل عند إغلاق الشمعة. استخدم سحابة EMA كدعم ديناميكي لتتبع وقف الخسارة.
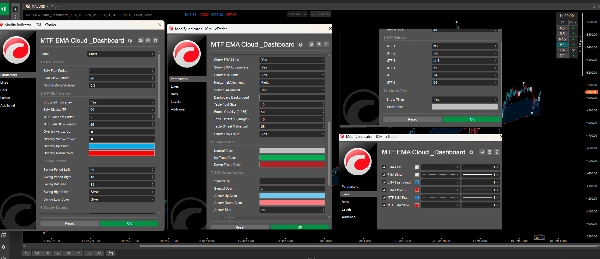
التخصيص
المؤشر قابل للتخصيص بدرجة عالية ليناسب أسلوبك:
- ضبط فترات EMA لكل من الوضع الحالي ووضع MTF.
- تغيير الألوان للسحب، الأسهم، التقلبات، ولوحة التحكم.
- تكوين موقع اللوحة وشفافيتها.
- تفعيل أو تعطيل أي ميزة بشكل مستقل.
الملخص
A smart dashboard displays trend status across six timeframes (from 3 minutes to daily), incorporating a neutral zone logic that highlights flat or consolidating markets to help avoid false signals. The dashboard is interactive, enabling quick chart switching by clicking on timeframe buttons. The tool automatically marks swing high and low points to assist in setting stop loss and take profit levels based on recent price structure. Visual crossover arrows signal EMA fast and slow line crossovers, with customizable colors and styles. Additionally, a candle timer shows the remaining time until the current candle closes, aiding precise trade timing.
The indicator is highly customizable, allowing adjustments to EMA periods, colors, dashboard position, transparency, and feature toggling to fit individual trading styles. It supports markets including Forex, Crypto, and commodities like gold (XAUUSD), and is tagged for use with symbols such as BTCUSD and USDJPY.
تقييمات العملاء
5 | 0 % | |
4 | 100 % | |
3 | 0 % | |
2 | 0 % | |
1 | 0 % |


