present
Zarejestruj się i otrzymaj 50 $ zniżki na pierwszy zakup
Trading product for TP_SL Wskaźnik Key Levels, image 1
TP_SL
Wskaźnik
127 pobrania
Wersja 1.1, Jun 2026
Windows, Mac
Trading product for TP_SL Wskaźnik Key Levels, image 2
Trading product for TP_SL Wskaźnik Key Levels, image 3
Trading product for TP_SL Wskaźnik Key Levels, image 4
Trading product for TP_SL Wskaźnik Key Levels, image 5
32
Sprzedaż
980
Bezpłatne instalacje

Opis

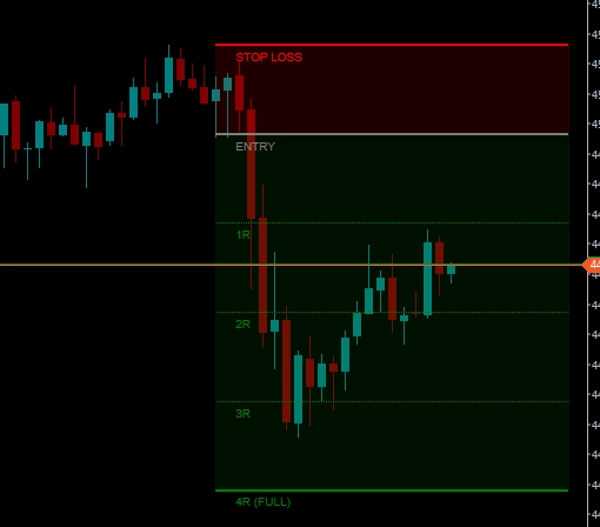
TP_SL Bardzo przydatne narzędzie Ryzyko & Zysk (w stylu TradingView)


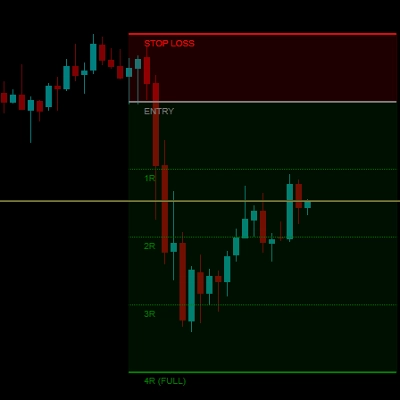
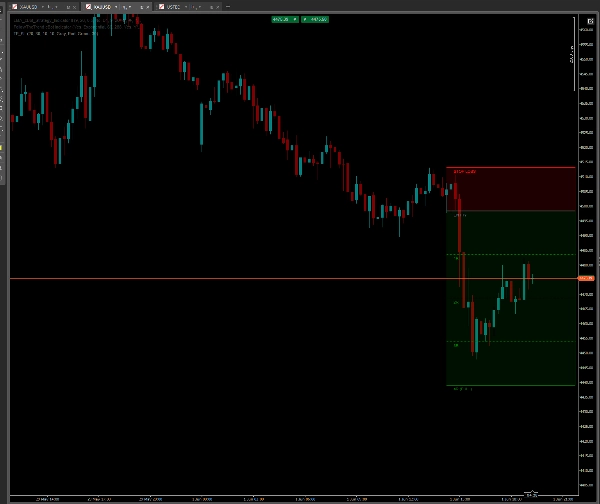
Przenieś najlepsze narzędzie do pozycji Long/Short w stylu TradingView bezpośrednio na swoje wykresy cTrader!

Jeśli kiedykolwiek brakowało Ci szybkiego, intuicyjnego i interaktywnego narzędzia do rysowania, które pozwala planować transakcje, obliczać ryzyko i wizualnie prognozować poziomy Take Profit, ten wskaźnik jest dla Ciebie. Zaprojektowany z myślą o szybkości i estetyce wykresu, pozwala na zaplanowanie ustawień transakcji w mniej niż sekundę.

🔥 Kluczowe funkcje:

  • Doświadczenie TradingView w cTrader: Odwzorowuje popularne wizualne narzędzie pozycji Long/Short.
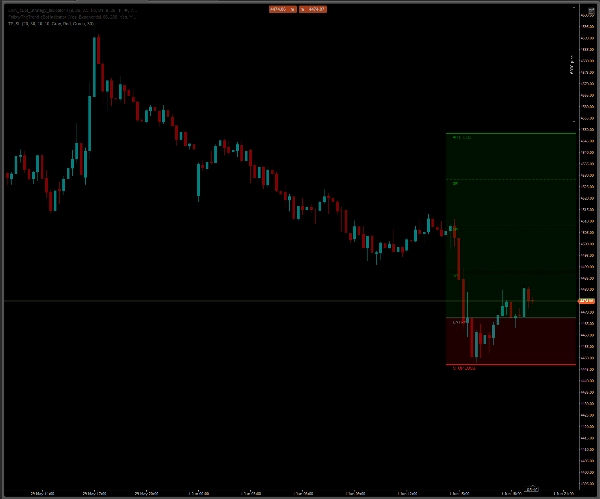
  • Inteligentne automatyczne przełączanie (Long/Short): Płynnie przełącza się między pozycjami Long i Short. Wystarczy przeciągnąć linię Stop Loss powyżej linii wejścia, a strefy Take Profit natychmiast odwrócą się w dół.
  • Automatyczne wielokrotności ryzyka (R-Math): Automatycznie oblicza Twoje ryzyko (1R) na podstawie odległości między wejściem a Stop Loss i dynamicznie prognozuje precyzyjne poziomy Take Profit dla 1R (bez ryzyka), 2R, 3R i 4R (pełny TP).
  • Technologia czystego wykresu: W przeciwieństwie do standardowych linii poziomych, które rozciągają się nieskończenie w lewo i zaśmiecają dane historyczne, to narzędzie używa ograniczonych linii. Tworzy schludny, samodzielny blok, który pozostaje dokładnie tam, gdzie go potrzebujesz.
  • Dynamiczne śledzenie ceny: W miarę pojawiania się nowych świec narzędzie automatycznie „unosi się” w prawo, pozostając blisko aktualnego ruchu cenowego.

⚡ Jak z niego korzystać:

  1. Rysuj: Przytrzymaj klawisz SHIFT i kliknij lewym przyciskiem myszy w dowolnym miejscu na wykresie. Ustawienie pojawi się natychmiast.
  2. Dopasuj: Po prostu przeciągnij i upuść szarą linię "ENTRY" lub czerwoną linię "STOP LOSS" na wybrane poziomy cenowe. Cała siatka oblicza się i dostosowuje w czasie rzeczywistym.
  3. Usuń: Kliknij linię wejścia lub Stop Loss i naciśnij klawisz Delete na klawiaturze. Wskaźnik posiada funkcję automatycznego czyszczenia, która natychmiast usunie cały rysunek, pozostawiając wykres bez bałaganu.

⚙️ W pełni konfigurowalne ustawienia:

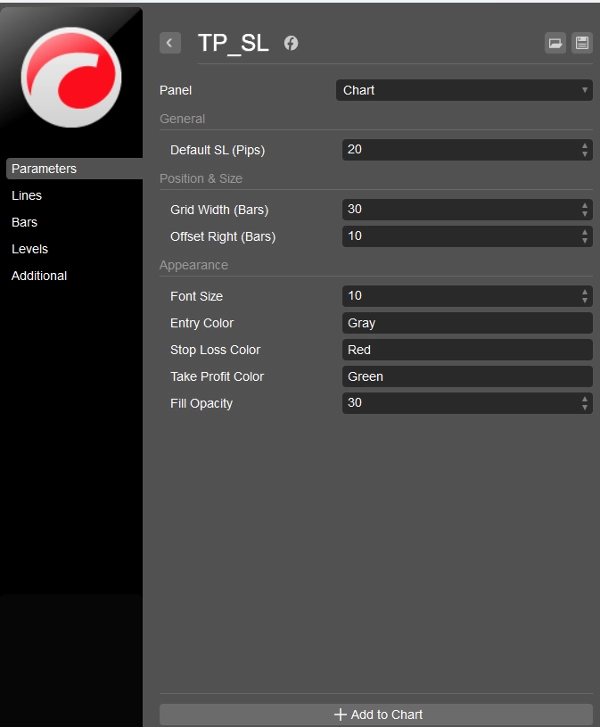
  • Szerokość siatki i przesunięcie: Dostosuj długość narzędzia (w słupkach) oraz jak blisko aktualnej ceny się znajduje.
  • Wygląd: Pełna kontrola nad kolorami. Wpisz dowolną standardową nazwę koloru (np. DodgerBlue, Orange, Gray) dla linii wejścia, SL i TP.
  • Przezroczystość: Dostosuj przezroczystość stref tła (od 0 do 255) dla eleganckiego, szklanego wyglądu.
  • Rozmiar tekstu: Dopasuj etykiety na wykresie do rozdzielczości ekranu.

Przestań zgadywać swoje cele. Wizualnie planuj transakcje, szanuj zarządzanie ryzykiem i utrzymuj wykresy idealnie czyste!

Ten wskaźnik jest całkowicie DARMOWY dla społeczności cTrader.

Podsumowanie

AI summary
TP_SL is a visual risk and reward indicator designed for cTrader that replicates the TradingView-style Long/Short position tool. It enables traders to quickly and intuitively plan trades by drawing and adjusting entry, stop loss, and take profit levels directly on the chart. The tool automatically calculates risk multiples (1R, 2R, 3R, 4R) based on the distance between entry and stop loss, projecting precise take profit zones.

Key features include a smart auto-flip function that switches between long and short positions by dragging the stop loss line above or below the entry line, clean bounded lines that avoid cluttering historical data, and dynamic price tracking that keeps the tool aligned with current price action. Users can draw the setup by holding SHIFT and left-clicking, then adjust levels with drag-and-drop, and delete the drawing with a single key press.

The indicator offers full customization of grid width, offset, colors, opacity, and text size to fit individual chart preferences. It supports visualization on bar-based data and is categorized under pattern indicators with a focus on key levels. TP_SL aims to facilitate precise trade planning and risk management while maintaining clean chart aesthetics.
Profil wskaźnika
Kategoria wskaźnika
Formacja
Typ wyjścia
Wizualizacja
Wymagania dotyczące danych
Tylko słupki

Opinie klientów

0.0
Opinie: 0
Opinie klientów
Ten produkt nie ma jeszcze opinii. Wypróbowałeś(-aś) go już? Bądź pierwszy(-a) i powiedz o tym innym!

Dyskusja

Częste pytania

Key Levels
Produkty dostępne za pośrednictwem cTrader Store, w tym boty handlowe, wskaźniki i wtyczki, dostarczane są przez deweloperów zewnętrznych i udostępniane wyłącznie w celach informacyjnych oraz w celu zapewnienia dostępu technicznego. cTrader Store nie jest brokerem i nie zapewnia doradztwa inwestycyjnego, nie udziela spersonalizowanych rekomendacji ani nie gwarantuje przyszłych wyników.

Więcej od tego autora

Wskaźnik
AI
Prop
+8
The EMA Trend Simple is a trend-following tool designed for simplicity and visual clarity.
cBot
Prop Firm Fit
Stop Loss (SL) Manager
+1
HTS Strategy Tester - Advanced Multi-Timeframe Trend & Pullback Trading System H1/m1 & H4/m5 WWS 33/144 Start from 100$
90.1%
ROI
2.92
Współczynnik zysku
Wskaźnik
AI
Grid
+7
Follow The Trend cBot - INDICATOR - displays two Moving Average Bands for cBot or for your own use
Wskaźnik
AI
SMC
+7
The ultimate tool for Price Action and ICT. High, Low and Mid levels for days, weeks Inc. NY Midnight and Custom Range.
Wskaźnik
ATR
Prop
+13
HCCC MTF (Hurst Cycle Composite Channel), Designed for Semi-Automated Trading, Interactive MTF Dashboard
Wskaźnik
ATR
MACD
+15
MACD Advanced -- It combines the standard MACD logic with a rich set of visual tools
Wskaźnik
AI
RSI
+7
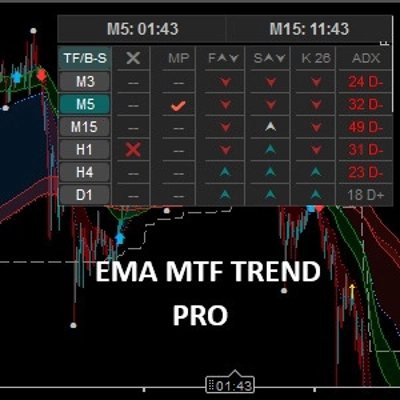
EMA MTF TREND PRO - Multi-timeframe trend analysis overlay indicator, 6 timeframes - in one table with ADX
Wskaźnik
AI
Prop
+7
EMA Clouds, Multi-Timeframe (MTF) Overlay, Swing High/Low detection, and a smart Dashboard with neutral zone filtering.
Wskaźnik
AI
SMC
+4
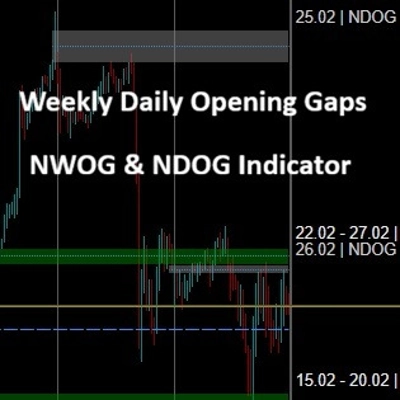
Weekly Daily Opening Gaps — NWOG & NDOG Indicator Professional-grade opening gap visualization for institutional traders
Wskaźnik
ATR
Channel
+1
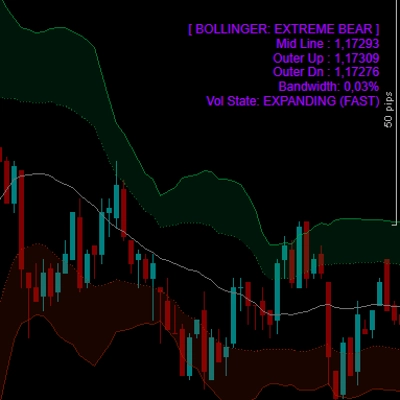
Bollinger Bands Advanced Squeeze & Breakout System, Real-Time On-Chart Dashboard, Auto-Squeeze Detector, Dual-Band Cloud
Wskaźnik
SMC
Prop
+11
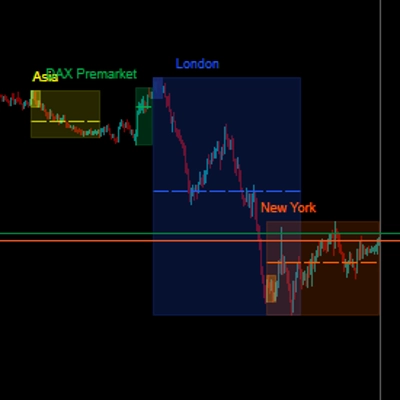
Sessions PRO is a professional session visualization indicator - 4 Fully Customizable Sessions
Logo „RSI Advanced”
Najwyżej oceniane
5.0
(4)
$20
/
$30
Wskaźnik
AI
ATR
+12
The standard Relative Strength Index (RSI), RSI & Signal Cloud, Smart Volatility Filter (ATR), On-Chart Info Dashboard

Możesz także polubić

Wskaźnik
Forex
EURUSD
+4
A precision overlay tool that combines session-aware VWAP logic and standard deviations.
Logo „Market Structure Shift”
Najwyżej oceniane
4.2
(4)
$19
/
$35
Wskaźnik
Prop
Forex
+11
Market Structure Shift – Professional Market Structure Oscillator
Wskaźnik
VWAP
Forex
+5
Dynamic Swing Anchored VWAP
Wskaźnik
CHOCH
Inducement
+5
TradeLens - Frame the Trade. Refine the Entry. Two Timeframes. One Decision.
Wskaźnik
MACD
Forex
+2
a revolutionary indicator that integrates volume into MACD.
Wskaźnik
AI
Forex
+13
SigmaTrend Oscillator is an advanced momentum-based trend identification tool that combines dynamic price
Wskaźnik
ATR
RSI
+5
One of the best indicators we have ever developed, with a very high profit ratio.
Wskaźnik
Volume
Select a price range and read POC, VAH and VAL from tick activity on your cTrader chart.
Wskaźnik
Indices
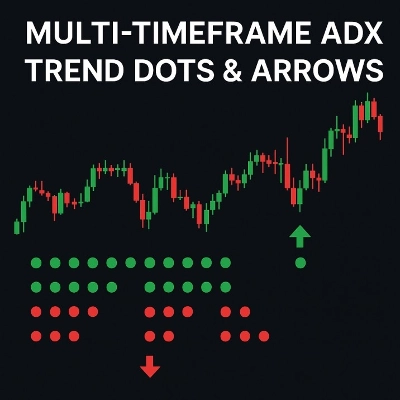
Multi-Timeframe ADX Trend Dots & Arrows
Wskaźnik
Prop
VWAP
+5
Multi-anchor VWAP indicator for cTrader. Plots two VWAP lines (red and blue) with selectable anchors.
Wskaźnik
VWAP
Volume
+5
Multi VWAP. Three timeframes. One clean chart. Your Essential Trading Tool.
Wskaźnik
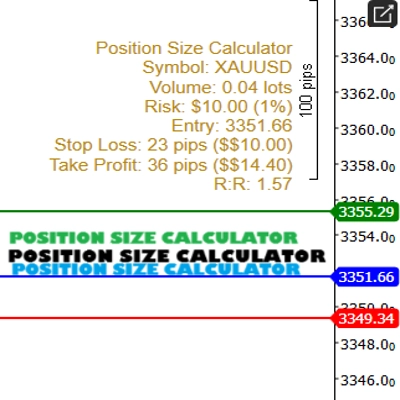
POSITION SIZE CALCULATOR
Wskaźnik
AI
ATR
+23
Candle Timer best used for Scalper
Wskaźnik
BOS
Add standard-timeframe context candles to a native Renko chart.
Wskaźnik
Forex
BTCUSD
+11
Unlock trading precision with QQE! Dual QQE indicators with a Bollinger Bands zero line provide clear buy/sell signals.
Logo „PivotLevels”
Najwyżej oceniane
4.7
(4)
$25
/
$30
Wskaźnik
Prop
Forex
+4
It draws Pivot Levels on the chart.
Logo „vwap”
Popularne
4.8
(5)
$26
Wskaźnik
VWAP
Forex
+2
Custom VWAP Indicator for cTrader
Wskaźnik
ATR
EMA
+4
The FULL-MARKET-VIEW-DASHBOARD is a professional-grade trading suite for cTrader that eliminates market noise.

Cena

32
Sprzedaż
980
Bezpłatne instalacje