

Description
This indicator is a visual analysis and signal tool designed to automate trading strategies based on session or specific hourly breakouts.
📊 Market Conditions Analyzed The indicator isolates the Price Action of a specific, user-defined hour. It automatically records the highest and lowest points of this reference hour (the "Range") and uses them as key levels for the rest of the trading day. Calculations are reset daily at midnight.
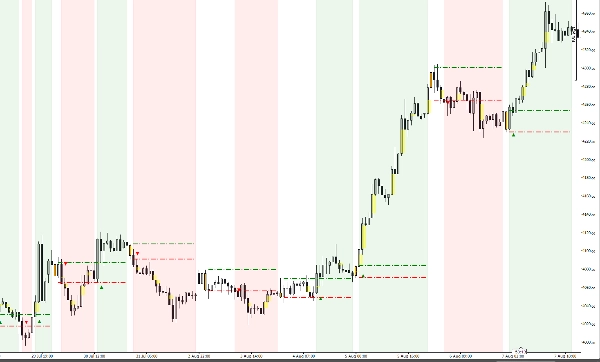
👁️ Signal Interpretation & Visual Elements The indicator is designed to be 100% visual:
- Colored Target Candle: The reference hour candle is highlighted (both fill and outline) for immediate identification.
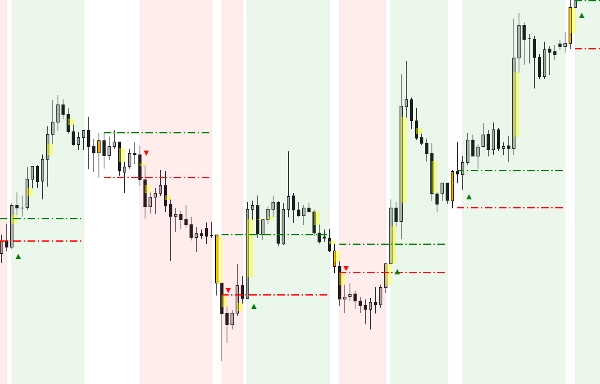
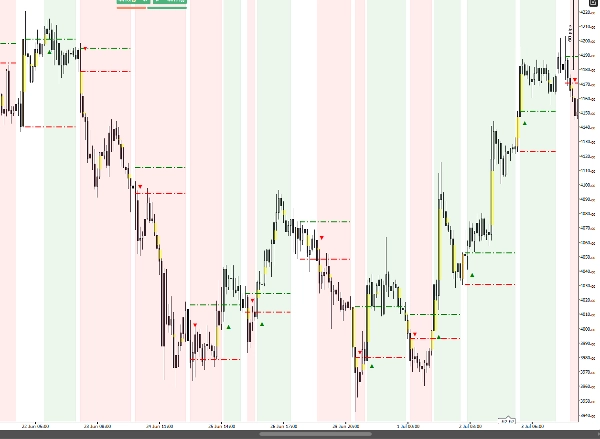
- Dotted Lines (High/Low): These project the reference range across the entire trading day.
- Signal Arrows (▲/▼): An arrow appears as soon as a candle closes outside the range (confirmed breakout), providing a clear entry point.
- Colored Background Zones: The chart background tints green (bullish bias) or red (bearish bias) to indicate the current momentum following the breakout.
⚙️ Key Parameters & Settings
- Target Hour (0-23): Selects the reference hour (leave as default).
- 100% Customizable Design: Choose the colors for the breakout lines (High/Low), the reference candle, and its outline.
- Background Opacity: Adjust the transparency (0-255) of the trend zones to keep your chart clean and readable.
📈 Typical Use Cases & Scenarios Ideal for Gold (XAUUSD) Day Trading. The typical scenario involves framing the pre-market volatility (e.g., Asian session or pre-London) and trading the strong momentum impulse that occurs when this range is broken at the open of major markets.
Summary
The indicator provides clear visual cues: the reference hour candle is highlighted with distinct colors; arrows appear when a candle closes outside the established range, signaling a confirmed breakout; and the chart background shifts to green or red to indicate bullish or bearish momentum following the breakout. Users can customize the target hour, colors of breakout lines and reference candle, and the opacity of background trend zones.
Typical use involves capturing pre-market volatility, such as during the Asian or pre-London sessions, and trading the momentum that follows when the price breaks out of the defined range at major market opens. The indicator supports breakout and trend strength signals based on bar data and tick data inputs.



















!["[Hamster-Coder] Moving Average MTF" logo](https://cdn.ctrader.com/image/webp/b11b98b1-194d-4b8e-b00e-d611826ad159_31226)


