
VWAP Volume Weighted Average Price
Indicator
Version 1.0, Oct 2025
Windows, Mac
4.6
Reviews: 3
Description
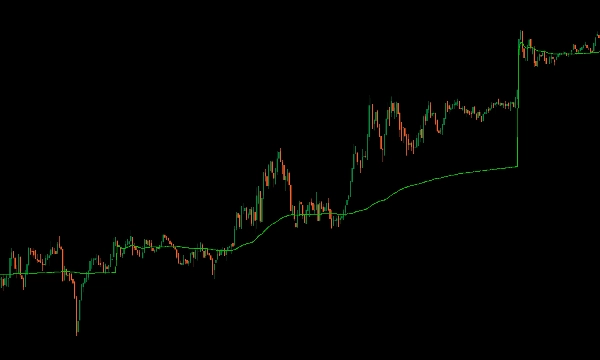
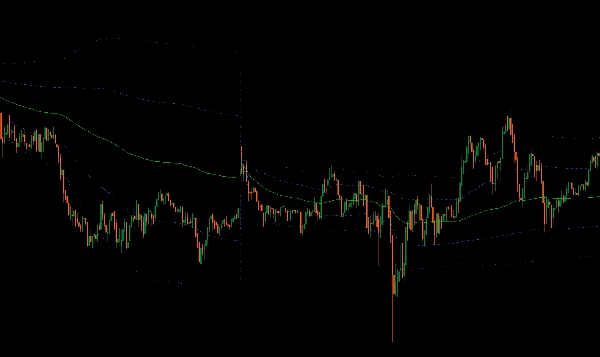
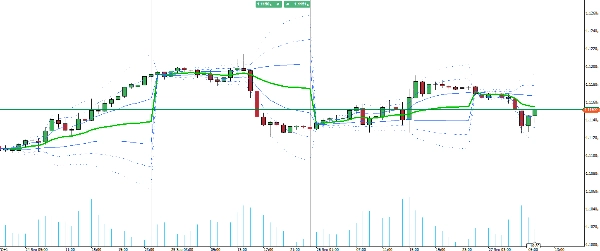
Introducing the VWAP indicator for cTrader, bringing the full functionality of TradingView's Volume Weighted Average Price to your trading platform.
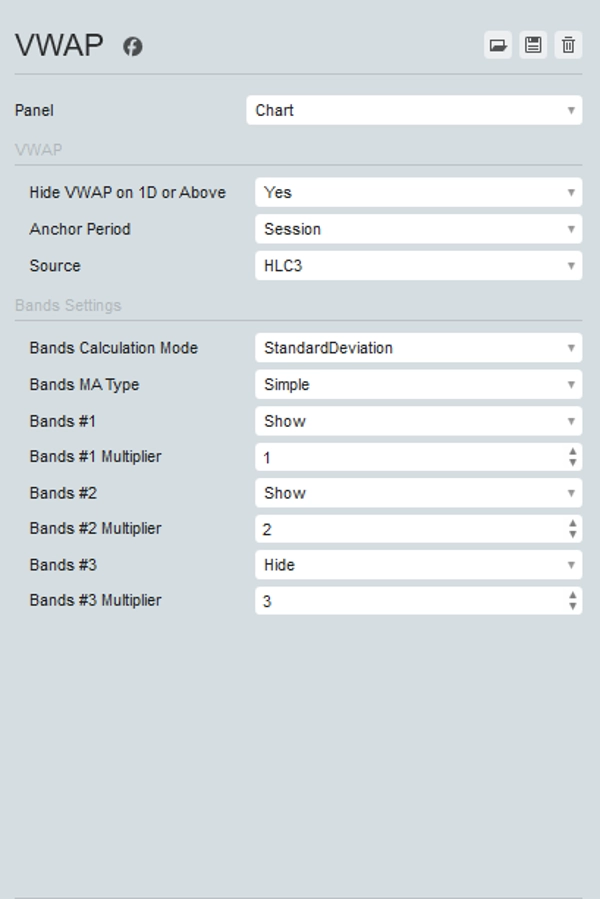
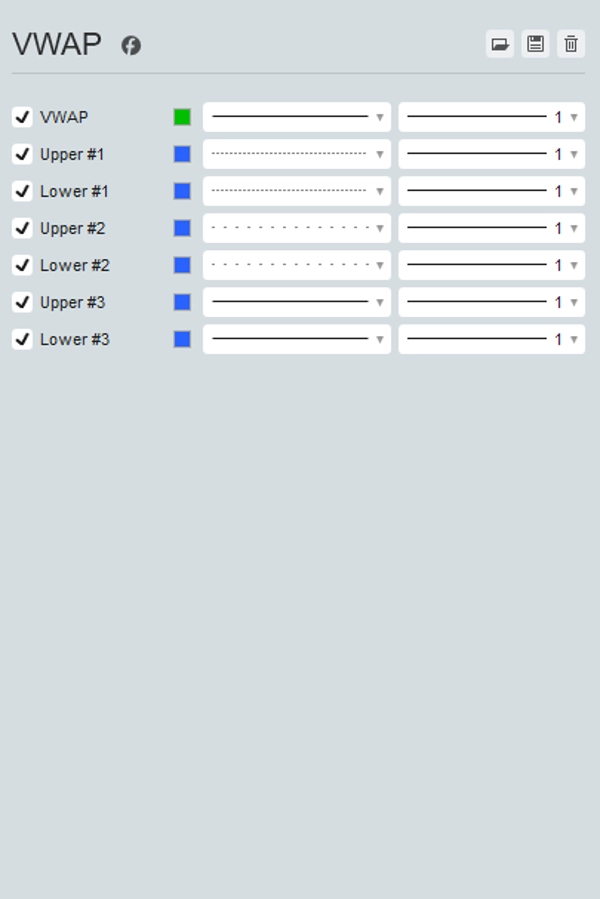
This comprehensive tool allows you to choose your anchor period (Session, Week, Month, Quarter, Year) and select from various price sources, including Open, High, Low, Close, HL2, HLC3, OHLC4, and HLCC4. Additionally, it can display up to three standard deviation upper and lower bands, providing a complete view of price distribution.
The VWAP indicator updates in real time with tick data, ensuring you have the most accurate and timely insights for your trading decisions. Elevate your trading strategy with the versatile and powerful VWAP indicator in cTrader.
Summary
AI summary
The VWAP (Volume Weighted Average Price) indicator for cTrader replicates the full functionality of TradingView's VWAP tool. It allows traders to select anchor periods including Session, Week, Month, Quarter, and Year, and choose from multiple price sources such as Open, High, Low, Close, HL2, HLC3, OHLC4, and HLCC4. The indicator also supports displaying up to three standard deviation bands above and below the VWAP line, providing insights into price distribution and volatility. It updates in real time with tick data, ensuring timely and accurate information for trading decisions. This indicator is applicable across various markets including Forex, Crypto, Stocks, Commodities, and Indices, and supports symbols like BTCUSD, EURUSD, GBPUSD, XAUUSD, NAS100, and USDJPY. It is suitable for strategies involving breakout and scalping techniques.
Indicator profile
Customer reviews
4.6
Reviews: 3
5 | 67 % | |
4 | 33 % | |
3 | 0 % | |
2 | 0 % | |
1 | 0 % |
Customer reviews
October 27, 2025
Solid enough as a backup opinion. Win rate means less without average R.
October 22, 2025
it earns a spot because the trade idea gets a pause before execution. A clean signal can still fail.
October 19, 2025
The idea is fine, just do not expect it to print perfect entries, and The result needs a journal.
Discussion
FAQ
BTCUSD
Forex
Breakout
Indices
EURUSD
Commodities
GBPUSD
NZDUSD
Prop
Scalping
Crypto
Stocks
XAUUSD
NAS100
USDJPY
VWAP
Products available through cTrader Store, including trading bots, indicators and plugins, are provided by third-party developers and made available for informational and technical access purposes only. cTrader Store is not a broker and does not provide investment advice, personal recommendations or any guarantee of future performance.


Price
Since 25/09/2025
25
Sales
331
Free installs