
คำอธิบาย
HCCC MTF - ช่องคอมโพสิตวงจร Hurst (ฟรี 100%)
ภาพรวม
เครื่องมือ HCCC MTF (ช่องคอมโพสิตวงจร Hurst) เป็นแดชบอร์ดและตัวบ่งชี้ช่องเวลาหลายกรอบ (MTF) ที่ทันสมัยและโต้ตอบได้อย่างเต็มที่ โดยอิงตามทฤษฎีวงจรของ J.M. Hurst ผสมผสานกับความผันผวน ATR เครื่องมือนี้ช่วยให้คุณระบุแนวโน้มตลาดที่แท้จริงและจุดเปลี่ยนวงจรที่สมบูรณ์แบบ (จุดสูงสุดและต่ำสุด) ในหลายกรอบเวลาได้พร้อมกัน
อันที่สองมุ่งเน้นการเทรดกึ่งอัตโนมัติด้วย https://ctrader.com/products/3618?u=cLogic
สำคัญ: ตัวบ่งชี้นี้ ฟรี 100% สำหรับทุกคน มันถูกพัฒนาเป็นเพื่อนร่วมทางภาพที่สมบูรณ์แบบสำหรับ cBot "Follow The Trend XAU Edition".
แม้ว่าคุณจะสามารถใช้มันได้อย่างสมบูรณ์แบบสำหรับการเทรดด้วยตนเอง แต่พลังที่แท้จริงจะถูกปลดล็อกเมื่อใช้ในระบบกึ่งอัตโนมัติ: คุณใช้แดชบอร์ด HCCC เพื่ออ่านวงจรและโมเมนตัมในกรอบเวลาที่สูงกว่า จากนั้นเปิดใช้งาน Follow The Trend XAU Edition cBot เพื่อดำเนินการและจัดการการเทรดในทิศทางนั้นอย่างแม่นยำ
คุณสมบัติหลัก
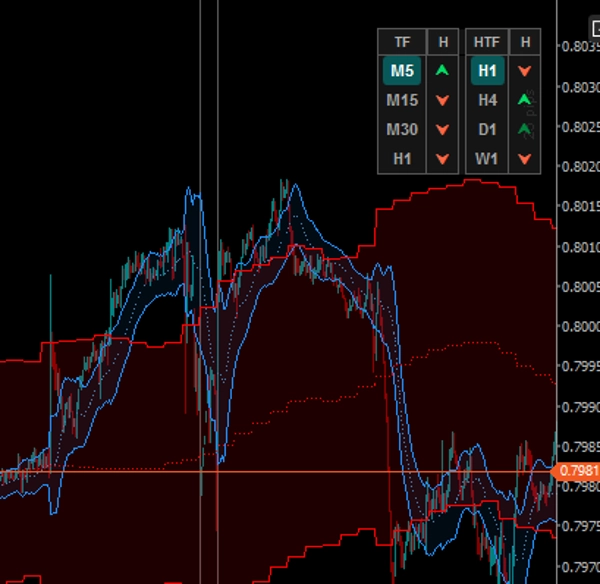
1. แดชบอร์ด MTF แบบโต้ตอบได้ (คลิกได้)
ลืมการสลับไปมาระหว่างชาร์ต แดชบอร์ดบนชาร์ตติดตาม 4 กรอบเวลาต่ำกว่า (LTF) และ 4 กรอบเวลาสูงกว่า (HTF)
- ปุ่ม LTF: คลิกปุ่ม LTF ใดก็ได้เพื่อเปลี่ยนกรอบเวลาของชาร์ตปัจจุบันทันที
- ปุ่ม HTF: คลิกปุ่ม HTF ใดก็ได้เพื่อฉายช่องกรอบเวลาสูงที่เลือกลงบนชาร์ตปัจจุบันของคุณทันที!
2. ระบบซ้อนทับช่องคู่
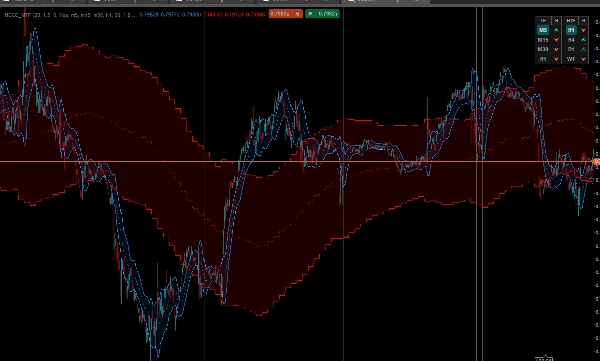
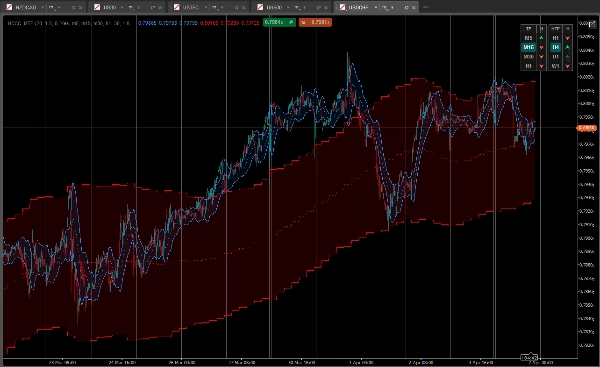
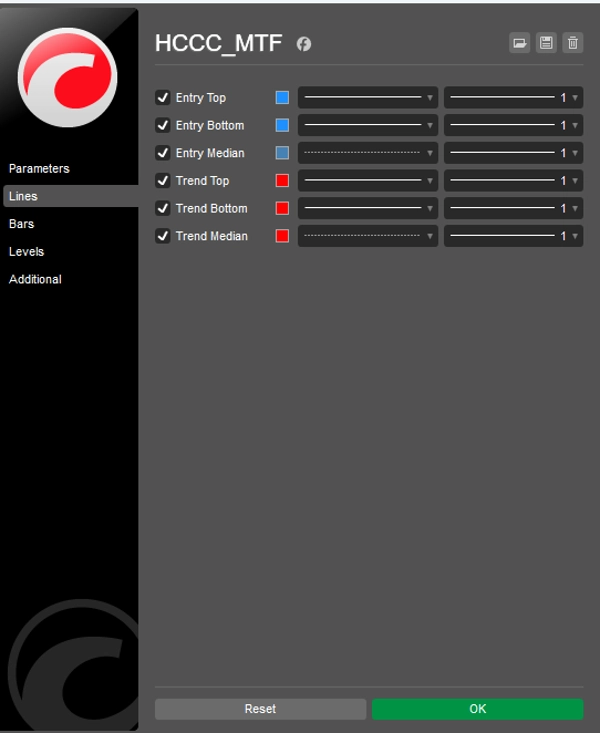
ตัวบ่งชี้จะแสดงช่องที่สวยงามสองช่องที่เต็มไปด้วยเมฆบนชาร์ตของคุณพร้อมกัน:
- วงจรเข้า (เมฆสีน้ำเงิน): คำนวณวงจร Hurst ตามกรอบเวลาชาร์ตปัจจุบันของคุณ
- วงจรแนวโน้ม (เมฆสีแดง): ช่องมุมมองมหภาคที่คำนวณจากกรอบเวลาสูงที่คุณเลือกในแดชบอร์ด
3. สัญญาณวงจร 5 สถานะขั้นสูง
แดชบอร์ดไม่ได้แสดงเพียงทิศทางแนวโน้มเท่านั้น แต่ยังแสดงเฟสของวงจรโดยวิเคราะห์ความชันของเส้นกลางและตำแหน่งราคาที่สัมพันธ์กับแถบ ATR
- [ ⮝ ] เขียวเข้ม (ซื้อแรง): ความชันของเส้นกลางขึ้น และราคาลดลงถึงแถบล่าง นี่คือจุดต่ำสุดของวงจร (ซื้อเมื่อราคาตก)
- [ ⮝ ] เขียวอ่อน (ซื้ออ่อน): แนวโน้มขึ้น แต่ราคาลอยอยู่รอบเส้นกลางหรือแถบบน
- [ — ] เทา (เป็นกลาง): วงจรแบน ไม่มีโมเมนตัมชัดเจน
- [ ⮟ ] แดงอ่อน (ขายอ่อน): แนวโน้มลง แต่ราคาอยู่ใกล้เส้นกลาง
- [ ⮟ ] แดงเข้ม (ขายแรง): ความชันของเส้นกลางลง และราคาปรับตัวขึ้นถึงแถบบน นี่คือจุดสูงสุดของวงจร (ขายเมื่อราคาขึ้น)
วิธีใช้ร่วมกับ cBot "Follow The Trend XAU Edition"?
- ดูที่ด้านขวาของแดชบอร์ด (คอลัมน์ HTF) รอการจัดแนวที่ชัดเจนในกรอบเวลาสูงกว่า (เช่น H4 และ D1 แสดงลูกศรเขียวเข้ม/เขียวอ่อน)
- ดูที่ด้านซ้ายของแดชบอร์ด (คอลัมน์ LTF) เพื่อหาการดึงกลับในพื้นที่ (เช่น M15 แสดงลูกศร "ซื้อแรง" สีเขียวเข้ม)
- เมื่อเหตุผล MTF สอดคล้องกัน ให้เปิดใช้งาน cBot Follow The Trend XAU Edition ในทิศทาง "ซื้อ" และปล่อยให้อัลกอริทึมจัดการการเข้าเทรด การตั้งจุดหยุดตาม และการบริหารความเสี่ยง
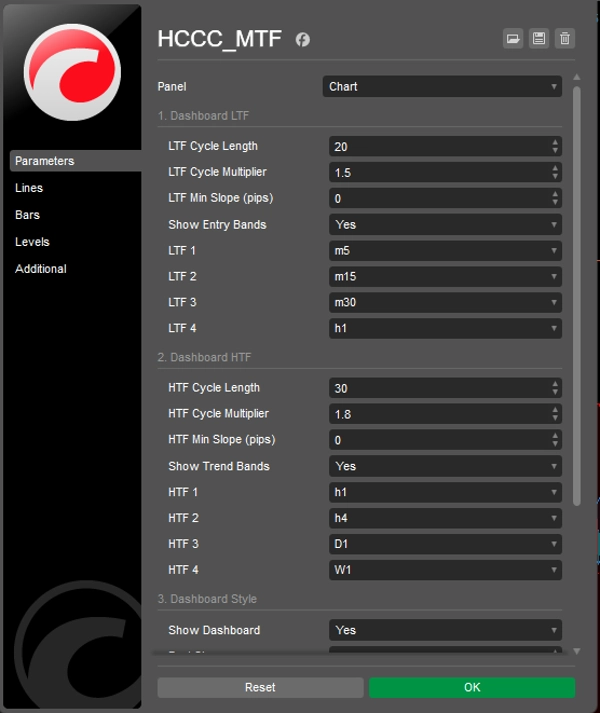
การปรับแต่ง
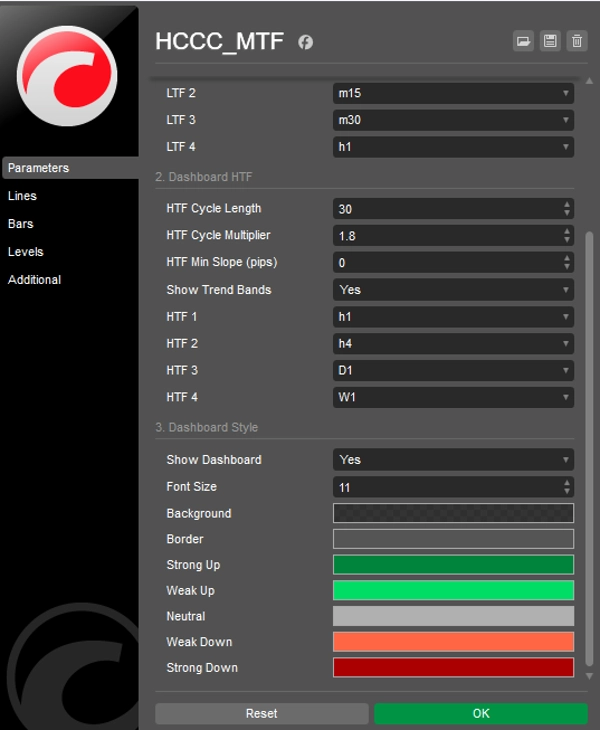
ทุกอย่างปรับแต่งได้เต็มที่: ความยาววงจร ตัวคูณ ATR ความไวความชันขั้นต่ำ (เป็นพิป) เพื่อกรองเสียงรบกวน และควบคุมสีและตำแหน่ง UI ได้อย่างเต็มที่
ดาวน์โหลดตอนนี้ฟรีและยกระดับการเทรดกึ่งอัตโนมัติของคุณไปอีกขั้น!
สรุป
It overlays two cloud-filled channels: a blue "Entry Cycle" channel based on the current timeframe and a red "Trend Cycle" channel derived from a selected higher timeframe. The dashboard provides advanced five-state cyclic signals indicating strong or weak buy/sell conditions and neutral phases by analyzing the slope of the median line and price position relative to ATR bands.
The indicator is fully customizable, including cycle lengths, ATR multipliers, slope sensitivity, and UI appearance. It is intended to complement the "Follow The Trend XAU Edition" cBot by providing visual cycle and momentum analysis to guide semi-automated trade execution and management. The HCCC MTF supports various markets including Forex, commodities, indices, stocks, and cryptocurrencies.


