الوصف
مؤشرات متجر Pinescriptlabs: روبوتات متجر Pinescriptlabs : (cBot) اختراق الذهب و BTCنقاط محورية للجلسة(جديد)
هيكل السوق المتقدم: Bos, Choch, SwinLevels, كتل الأوامر، مكتشف هيكل السوق والسيولة (جديد)
خوارزمية ذكية متتبعة (جديد)
دعم ومقاومة SmartTrend
خطوط
Lines
تحليل
هيكل السوق الديناميكي
لـ
نقاط
الانعطاف
فيبوناتشي
انحدار خطي
متعدد الأطر الزمنية
Regression
متعدد المستويات
تتبع انحياز الشمعة
المتعقب
دعم ومقاومة
اتجاه تلقائي
خطوط
Lines
جميع
مستويات الدعم و
المقاومة
Levels
🌟 جهد رائع من الفريق لتطوير هذا المؤشر على Ctrader! ادعمنا بالمشاركة - تحسينات بصرية بما في ذلك التمرير الأفقي قادمة قريبًا!
⚠️ ملاحظة تقنية: يتطلب التكبير/التمرير اليدوي حاليًا للعرض الأمثل ("قيد مؤقت: يعمل بشكل أفضل على الأطر الزمنية أقل من 1 ساعة بسبب قيود العرض في منصة Ctrader")
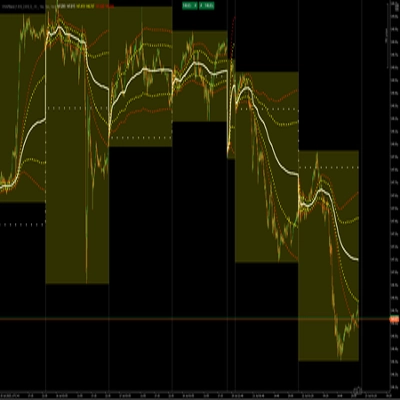
📊 عرض HTF في الوقت الحقيقي
يعرض هذا الخوارزم الشموع ذات الإطار الزمني الأعلى (1W, 1D, 4H, 1H) مباشرة على مخطط التداول الخاص بك، مما يمنحك هيكل السوق الكامل بنظرة واحدة - دون الحاجة لتبديل النوافذ!
🔍 تحليل سريع
اكتشف الاتجاهات الرئيسية (الاتجاه اليومي/الأسبوعي) أثناء التداول على أطر زمنية أقل
• ميزة متقدمة: تتحدث شموع HTF في الوقت الحقيقي - التغيرات اللونية تظهر فورًا تحولات الزخم
⚙️ كيفية الاستخدام
• تبديل كتل HTF الفردية تشغيل/إيقاف
• ضبط الشموع المرئية (1-10 لكل إطار زمني)
💡 فوائد تغير قواعد اللعبة
الآن يمكنك:
1️⃣ توقع إغلاق الشموع الرئيسية
2️⃣ اكتشاف انعكاسات الاتجاه مباشرة
3️⃣ مراقبة المستويات الرئيسية عبر أطر زمنية متعددة في نفس الوقت
🚀 التحسينات القادمة
سيمكن التمرير الأفقي من:
• تحليل نمط HTF التاريخي
• مقارنة الهيكل الحالي مع السابق
• تحديد المناطق الرئيسية على أطر زمنية أعلى
📚 أمثلة عملية
• عندما يكون 1W = أخضر و 1D = أحمر → السوق يصحح ضمن اتجاه صعودي → فقط بيع عند ارتدادات المقاومة الرئيسية
• تسلسل الاتجاه: 1W > 1D > 4H > 1H → دائمًا تداول مع اتجاه الشمعة الأسبوعية
• إدخالات التقاء:
- السعر عند دعم 1D + شمعة 4H خضراء ناشئة = فرصة شراء
- مقاومة عند قمة 1H + شمعة 4H حمراء = بيع مع وقف خسارة فوق القمة
• أنماط الاختراق: - إذا كسرت شمعة 1H القمة السابقة قبل الإغلاق (المؤقت نشط)، توقع استمرار صعودي
الملخص
Users can toggle individual higher timeframe candle blocks on or off and adjust the number of visible candles per timeframe (1 to 10). This facilitates monitoring of key levels and trend directions across multiple timeframes simultaneously. Practical use cases include anticipating candle closings, detecting live trend reversals, and identifying confluence entries based on support, resistance, and candle color changes.
Due to platform visual constraints, manual zoom and scroll are currently required for optimal viewing, especially on timeframes below 1 hour. Planned updates will introduce horizontal scrolling to enable historical pattern analysis, comparison of current versus past structures, and identification of key zones on higher timeframes.
HTF Candles supports traders in aligning trades with higher timeframe trends and enhances multi-timeframe market analysis within a single chart view.