
الوصف
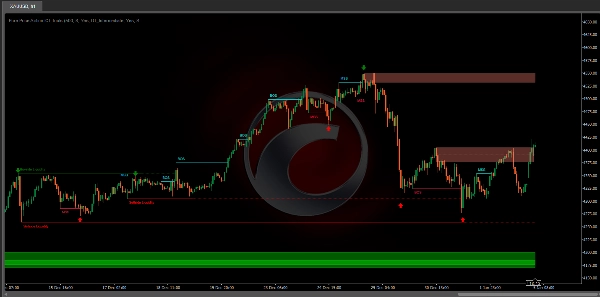
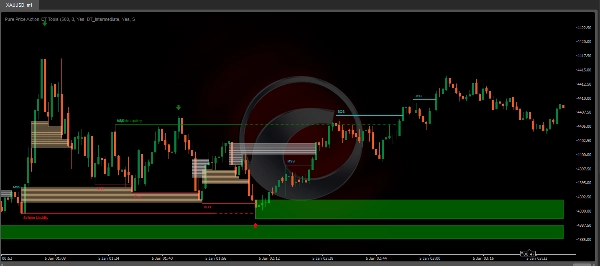
مؤشر Pure Price Action ICT Tools مصمم لتحليل حركة السعر النقية، حيث يحدد تلقائيًا هياكل السوق في الوقت الحقيقي، ومستويات السيولة، وكتل الأوامر والكسر، والفجوات في السيولة.
تتمثل ميزته الفريدة في اعتماده الحصري على أنماط السعر، دون التقيد بأي مدخلات يحددها المستخدم، مما يضمن تحليلًا قويًا وموضوعيًا لديناميكيات السوق.
الميزات الرئيسية
- هياكل السوق
تحول هيكل السوق، المعروف أيضًا بتغيير الطابع (CHoCH)، هو حدث محوري في تحليل حركة السعر يشير إلى احتمال تغير في اتجاه أو مزاج السوق. يحدث MSS عندما يعكس السعر اتجاهًا محددًا، مما يشير إلى أن الاتجاه السائد قد يفقد زخمه وقد يكون هناك انعكاس قادم. غالبًا ما يتم تحديد هذا التحول بواسطة أنماط فنية رئيسية، مثل قاع أعلى في اتجاه هابط أو قمة أدنى في اتجاه صاعد، والتي تشير إلى ضعف قوة الاتجاه الحالي.
كسر الهيكل عادة ما يشير إلى استمرار الاتجاه الحالي للسوق. يحدث هذا الحدث عندما يتحرك السعر بشكل حاسم فوق أو تحت قمة أو قاع سابق، مما يؤكد قوة الاتجاه السائد. في الاتجاه الصاعد، يتم تمييز BOS بكسر السعر فوق قمة سابقة، بينما في الاتجاه الهابط، يتم تحديده بكسر السعر تحت قاع سابق.
بينما يمكن أن يشير تحول هيكل السوق (MSS) إلى احتمال انعكاس الاتجاه وغالبًا ما يؤكد كسر الهيكل (BOS) استمرار الاتجاه، إلا أنهما لا يضمنان انعكاسًا كاملاً أو استمرارًا. يمكن أن تعمل مستويات MSS و BOS أيضًا كمناطق سيولة أو مناطق تجمع سعري بدلاً من الإشارة الحاسمة إلى تغير اتجاه السوق. يجب على المتداولين التعامل مع هذه الإشارات بحذر والتحقق منها بعوامل إضافية قبل اتخاذ قرارات التداول. لمزيد من التفاصيل حول مكونات الأداة الأخرى، يرجى الرجوع إلى الأقسام التالية.
- كتل الأوامر والكسر
كتل الأوامر والكسر هي مفاهيم رئيسية في تحليل حركة السعر تساعد المتداولين على تحديد مستويات مهمة في هيكل السوق.
كتل الأوامر هي مناطق سعرية محددة حيث حدث نشاط شراء أو بيع كبير. غالبًا ما تمثل هذه المناطق أفعال المتداولين المؤسسيين الكبار أو صانعي السوق، الذين ينفذون أوامر كبيرة تؤثر على السوق.
كتل الكسر هي مناطق سعرية محددة يحدث فيها انعكاس قوي، مما يسبب كسرًا في هيكل السوق السائد. تشير هذه الكتل إلى مناطق حيث واجه السعر مقاومة أو دعمًا كبيرًا، مما أدى إلى انعكاس.
باختصار، توفر سيولة جانب الشراء والبيع رؤى حاسمة حول ديناميكيات العرض والطلب في السوق، مما يساعد المتداولين على اتخاذ قرارات مستنيرة بناءً على توفر الأوامر عند مستويات سعرية مختلفة.
- سيولة جانب الشراء والبيع
تعد مناطق سيولة جانب الشراء والبيع حاسمة لتحديد نقاط التحول المحتملة في السوق. هذه المناطق هي حيث يتركز اهتمام الشراء أو البيع الكبير، مما يؤثر على تحركات السعر المستقبلية.
باختصار، توفر سيولة جانب الشراء والبيع رؤى حاسمة حول ديناميكيات العرض والطلب في السوق، مما يساعد المتداولين على اتخاذ قرارات مستنيرة بناءً على توفر الأوامر عند مستويات سعرية مختلفة.
- الفجوات في السيولة
الفجوات في السيولة هي فجوات أو مناطق على مخطط السعر حيث يوجد نقص في نشاط التداول. تمثل هذه الفجوات مناطق بها أوامر شراء أو بيع قليلة أو معدومة، مما يؤدي غالبًا إلى تحركات سعرية حادة عندما يدخل السوق هذه المناطق.
باختصار، الفجوات في السيولة هي مناطق حاسمة على مخطط السعر تتميز بنقص نشاط التداول. يمكن أن تؤدي هذه الفجوات إلى تحركات سعرية سريعة وزيادة في التقلبات، مما يجعلها اعتبارات أساسية للمتداولين في تحليلاتهم وعمليات اتخاذ القرار.
- نقاط التأرجح
تُعرف نقاط السعر التي يحدث عندها انعكاس عادةً بنقاط التأرجح. غالبًا ما يحلل المتداولون نقاط التأرجح التاريخية لفهم اتجاهات السوق وتحديد نقاط الدخول والخروج المحتملة للتداول.
يرجى ملاحظة أنه في هذا السكريبت تخضع هذه النقاط للرسم الخلفي، أي أنها ليست موجودة في المكان الذي يتم اكتشافها فيه.
يعتمد اكتشاف نقاط التأرجح والميزة الفريدة لهذا السكريبت بشكل حصري على حركة السعر، مما يلغي الحاجة إلى إعدادات رقمية يحددها المستخدم. تبدأ العملية باكتشاف نقاط التأرجح قصيرة الأجل:
- قمة تأرجح قصيرة الأجل (STH): تُعرف بأنها قمة سعر محاطة بقمم أدنى على الجانبين.
- قاع تأرجح قصيرة الأجل (STL): تُعرف بأنها قاع سعر محاط بقيعان أعلى على الجانبين.
يتم اكتشاف نقاط التأرجح متوسطة وطويلة الأجل باستخدام نفس النهج ولكن مع تعديل بسيط. بدلاً من تحليل شموع السعر مباشرة، يتم استخدام نقاط التأرجح قصيرة الأجل المكتشفة سابقًا. بالنسبة لنقاط التأرجح متوسطة الأجل، يتم تحليل نقاط التأرجح قصيرة الأجل، بينما لنقاط التأرجح طويلة الأجل، يتم استخدام نقاط التأرجح متوسطة الأجل.
تضمن هذه الطريقة تحليلًا قويًا وموضوعيًا لديناميكيات السوق، مما يوفر للمتداولين رؤى موثوقة حول هياكل السوق. تعتبر نقاط التأرجح المكتشفة أساسًا لتحديد هياكل السوق، ومستويات سيولة جانب الشراء/البيع، وكتل الأوامر والكسر المقدمة مع هذه الأداة.
باختصار، نقاط التأرجح هي عناصر أساسية في التحليل الفني، تساعد المتداولين على تحديد الاتجاهات ومستويات الدعم والمقاومة ونقاط الدخول والخروج المثلى. فهم نقاط التأرجح يسمح للمتداولين باتخاذ قرارات مستنيرة بناءً على تحركات السعر الطبيعية في السوق.
الإعدادات
- هياكل السوق
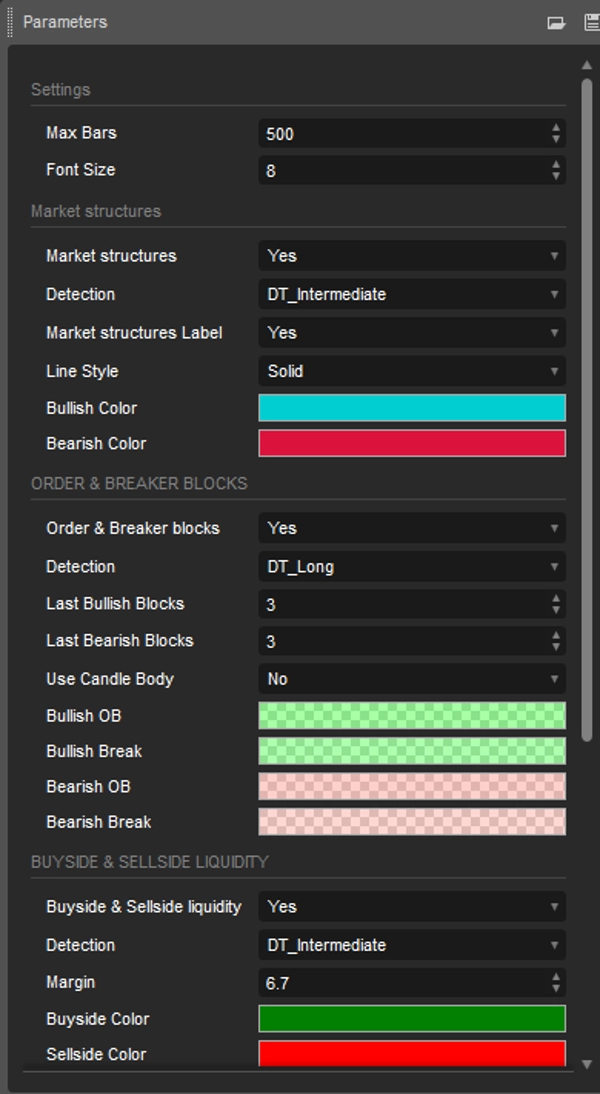
هياكل السوق: تبديل ظهور هياكل السوق، سواء التحولات أو الكسور.
الاكتشاف: خيار يسمح للمستخدمين باكتشاف هياكل السوق بناءً على أهمية مستويات التأرجح، بما في ذلك قصيرة الأجل ومتوسطة الأجل وطويلة الأجل.
تسميات هيكل السوق: تتحكم في ظهور التسميات التي تبرز نوع هيكل السوق.
نمط الخط: يخصص نمط الخطوط التي تمثل هيكل السوق.
- كتل الأوامر والكسر
كتل الأوامر والكسر: تبديل ظهور كتل الأوامر والكسر.
الاكتشاف: خيار يسمح للمستخدمين باكتشاف كتل الأوامر والكسر بناءً على أهمية مستويات التأرجح، بما في ذلك قصيرة الأجل ومتوسطة الأجل وطويلة الأجل.
آخر الكتل الصاعدة: عدد أحدث كتل الأوامر/الكسر الصاعدة التي يتم عرضها على المخطط.
آخر الكتل الهابطة: عدد أحدث كتل الأوامر/الكسر الهابطة التي يتم عرضها على المخطط.
استخدام جسم الشمعة: يسمح للمستخدمين باستخدام أجسام الشموع كمناطق كتل الأوامر بدلاً من نطاق الشمعة الكامل.
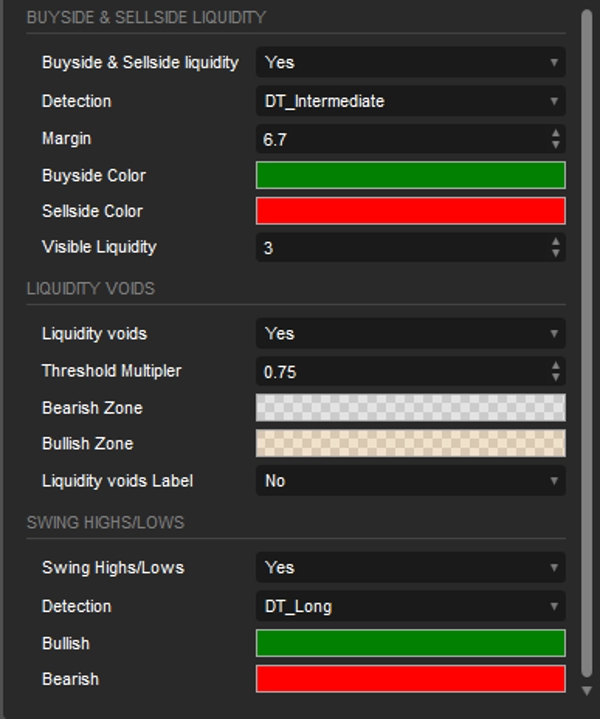
- سيولة جانب الشراء والبيع
سيولة جانب الشراء والبيع: تبديل ظهور مستويات سيولة جانب الشراء والبيع.
الاكتشاف: خيار يسمح للمستخدمين باكتشاف سيولة جانب الشراء والبيع بناءً على أهمية مستويات التأرجح، بما في ذلك قصيرة الأجل ومتوسطة الأجل وطويلة الأجل.
الهامش: يحدد الهامش/الحساسية لاكتشاف مستوى السيولة.
السيولة المرئية: تتحكم في كمية مستويات/مناطق السيولة التي يتم تصورها.
- الفجوات في السيولة
الفجوات في السيولة: تمكين عرض كل من فجوات السيولة الصاعدة والهابطة.
مضاعف العتبة: يحدد المضاعف للعتبة، والذي يتم ترميزه صلبًا على نطاق ATR لفترة 200.
التسمية: تمكين عرض تسمية تشير إلى فجوات السيولة.
- نقاط التأرجح
قمم/قيعان التأرجح: تبديل ظهور مستويات التأرجح.
الاكتشاف: خيار يسمح للمستخدمين باكتشاف مستويات التأرجح بناءً على أهمية مستويات التأرجح، بما في ذلك قصيرة الأجل ومتوسطة الأجل وطويلة الأجل.
الملخص
Key functionalities include:
- Market Structures: Detects Market Structure Shifts (potential trend reversals) and Breaks of Structure (trend continuations) based on price patterns.
- Order & Breaker Blocks: Highlights significant price zones where institutional buying/selling or strong reversals occur.
- Buy-side & Sell-side Liquidity: Identifies zones of concentrated buying or selling interest that may influence price movements.
- Liquidity Voids: Marks price chart gaps with minimal trading activity, often leading to sharp price moves.
- Swing Points: Detects short-, intermediate-, and long-term reversal points to aid in trend analysis and trade decision-making.
The tool offers customizable settings to toggle visibility and detection sensitivity for each feature, including options to adjust detection based on swing level significance and display preferences. It supports analysis across various markets such as Forex, Crypto (e.g., BTCUSD), and indices (e.g., NAS100, XAUUSD). The indicator provides an objective framework for analyzing market dynamics based solely on price action patterns.
تقييمات العملاء
5 | 67 % | |
4 | 0 % | |
3 | 33 % | |
2 | 0 % | |
1 | 0 % |


