
Dem
مؤشر
2 عمليات الشراء
الإصدار 2.0، Apr 2026
Windows, Mac
4.2
التقييمات: 4

الوصف
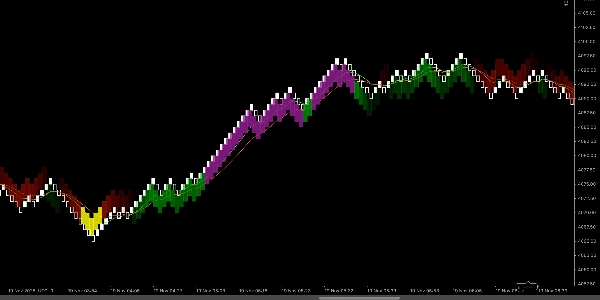
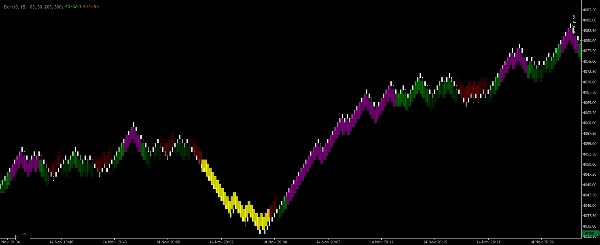
مناطق Renko EMA-Scalper هو مؤشر سكالبينج بصري وخفيف الوزن مصمم حصريًا لـ مخططات Renko 100-نقطة على منصة cTrader. يستخدم متوسطين متحركين أسيين (EMAs) لتحديد اتجاه الاتجاه قصير الأجل ولتسليط الضوء على مناطق نظيفة وقابلة للتداول. يرسم المؤشر مستطيلات مملوءة على المخطط بأربعة ألوان حتى يتمكن المتداولون السريعون من قراءة تحيز السوق فورًا ورصد نقاط دخول ذات احتمالية أعلى دون الحاجة إلى حسابات يدوية.
ماذا يعني كل لون
- المستطيل الأخضر — تأكيد الاتجاه الصعودي. المتوسط المتحرك السريع فوق المتوسط المتحرك البطيء والمتوسطات متجهة للأعلى. استخدمه للشراء القصير والمتابعة الاتجاهية.
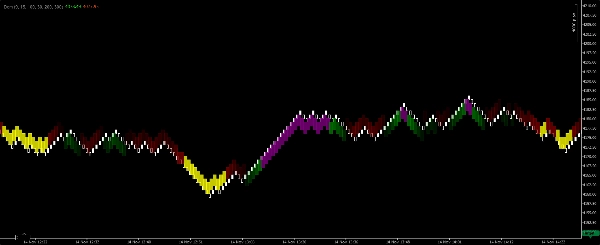
- المستطيل البنفسجي — منطقة دخول شراء داخل سياق صعودي. يشير إلى تراجع قصير الأجل أو تماسك داخل اتجاه صعودي نشط قد يوفر فرصة دخول سكالبينج.
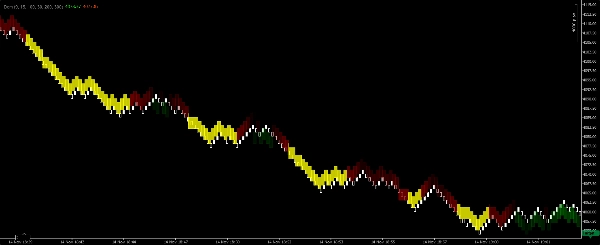
- المستطيل الأحمر — تأكيد الاتجاه الهبوطي. المتوسط المتحرك السريع تحت المتوسط المتحرك البطيء والمتوسطات متجهة للأسفل. استخدمه للبيع القصير والمتابعة الاتجاهية.
- المستطيل الأصفر — منطقة دخول بيع داخل سياق هبوطي. يشير إلى تراجع قصير الأجل أو تماسك داخل اتجاه هبوطي نشط قد يوفر فرصة دخول سكالبينج.
كيف يعمل (ملخص المنطق)
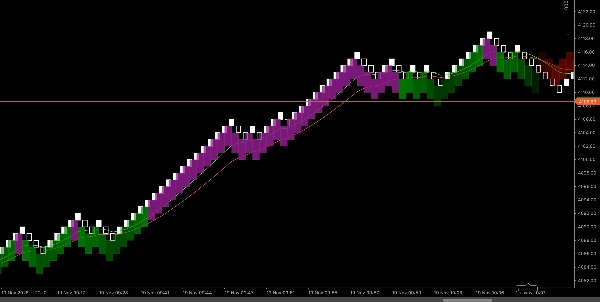
- يقوم المؤشر بحساب متوسطين متحركين أسيين (سريع وبطيء) على مخطط Renko 100-نقطة ويقيم محاذاتهما النسبية وانحدارهما لتحديد اتجاه الاتجاه.
- عندما تشير المتوسطات المتحركة إلى محاذاة صعودية واضحة وزخم، يرسم المؤشر مستطيل أخضر يغطي منطقة الاتجاه. إذا ظهر تماسك قصير أو تراجع داخل تلك المنطقة الصعودية، يرسم المؤشر مستطيل بنفسجي لتحديد فرصة دخول شراء.
- ينطبق نفس المنطق بالعكس للحالات الهبوطية، حيث ينتج مستطيلات حمراء (اتجاه) وصفراء (دخول).
- ترسم المستطيلات كمناطق (وليس أشرطة فردية) حتى يتمكن المتداولون السريعون من تقييم بصري لموعد الدخول والخروج السريع.
الإعدادات الموصى بها (إعدادات السكالبينج الافتراضية)
- نوع المخطط: Renko
- حجم طوبة Renko: 100 نقطة (المؤشر مصمم لهذا الحجم من الطوبة).
- الحساسية / الكشف — معلمة قابلة للتعديل تتحكم في مدى صرامة متطلبات المؤشر لمحاذاة المتوسطات المتحركة قبل رسم مستطيلات الاتجاه (الأقل = إشارات أكثر؛ الأعلى = إشارات أقل وأقوى).
- عتامة المستطيل — اضبطها للوضوح البصري فوق أشرطة السعر.
- مرشح الجلسة — يُنصح بتقييدها لساعات السيولة العالية للسكالبينج.
- أقصى عرض للمنطقة (أشرطة) — حد اختياري لتجنب المناطق الممتدة بشكل مفرط.
إرشادات الاستخدام وقواعد السكالبينج
- عامل الأخضر/الأحمر كمؤشر تأكيد الاتجاه. يُفضل التداول في اتجاه منطقة الاتجاه الملونة وتجنب السكالبينج العدواني عكس الاتجاه عندما يهيمن مستطيل الاتجاه.
- استخدم البنفسجي/الأصفر كمنافذ دخول للسكالبينج ضمن الاتجاه المؤكد — ابحث عن محفز هيكلي صغير سريع (مثل شريط زخم، اختراق تماسك صغير) قبل الدخول.
- يجب أن تكون الأهداف ضيقة وواقعية للسكالبينج (مضاعفات صغيرة من وقف الخسارة الخاص بك). استخدم أهداف نقاط ثابتة أو تأكيدات الحد الأدنى للأشرطة حسب ملف المخاطرة الخاص بك.
- ضع أوامر وقف الخسارة خلف أدنى/أعلى هيكل صغير حديث أو خارج منطقة الدخول؛ يتطلب السكالبينج انضباطًا وخسائر صغيرة.
- ادمج مع تأكيد الحجم/حركة السعر (إذا كان متاحًا) وتداول فقط خلال الجلسات النشطة.
- اختبر بصريًا على أدواتك — يفضل Renko 100-نقطة الأزواج والأدوات المتقلبة حيث تنتج طوبات 100-نقطة هيكل سعر مفيد للسكالبينج.
الملخص
ملف تعريف المؤشر
تقييمات العملاء
4.2
التقييمات: 4
5 | 50 % | |
4 | 25 % | |
3 | 25 % | |
2 | 0 % | |
1 | 0 % |
تقييمات العملاء
November 25, 2025
A decent setup here should survive 50 quick trades without looking messy. A few sessions of data make the result easier to trust. The useful comparison is hit rate versus average R.
November 18, 2025
The product feels more useful when the plan is already written down. A 13 setup run on daily close keeps the review grounded.
November 18, 2025
This feels useful when you already has a plan. The main value is short term execution, not chasing every signal that appears. Early sizing should stay modest until the journal looks stable.
November 18, 2025
Useful tool, but not for lazy entries. It supports short term execution and feels more useful if the trader stays selective.
مناقشة
الأسئلة الشائعة
BTCUSD
Forex
Signal
Scalping
Commodities
Crypto
XAUUSD
يتم توفير المنتجات المتاحة من خلال cTrader Store، بما في ذلك روبوتات التداول والمؤشرات والإضافات، من قبل مطوري الطرف الثالث وإتاحتها لأغراض الوصول المعلوماتي والفني فقط. cTrader Store ليس وسيطًا ولا يقدم نصائح استثمارية أو توصيات شخصية أو أي ضمان للأداء المستقبلي.
المزيد من هذا المؤلف


السعر
منذ 14/03/2025
23
المبيعات