
VIX - volatility indicator
مؤشر
2 عمليات الشراء
الإصدار 1.2، Apr 2026
Windows, Mac
4.5
التقييمات: 2
الوصف
هذا المؤشر الحصري لـ VIX، المدعوم بمؤشر النطاق الحقيقي المتوسط (ATR)، يقدم تحليلاً دقيقًا وواضحًا لتقلبات السوق، مُحسّنًا لمنصة cTrader 5.5.13+. يجمع بين حركة VIX المقاسة مع تحليل الحجم لتأكيد التحولات الكبرى والاختراقات المحتملة.
الميزات الرئيسية وجودة الكود
- صفر أخطاء/تحذيرات: تم إعادة هيكلة كاملة لأحدث واجهة برمجة تطبيقات cTrader، مما أزال جميع الأخطاء والتحذيرات القديمة لتحقيق أقصى استقرار وأداء.
- VIX قائم على ATR: يوفر مقياسًا سريع الاستجابة للتقلبات، مع تطبيع للحالات السوقية القصوى.
- تأكيد مزدوج: يستخدم التقلب (خط VIX) مع بيانات حجم التيك للتحقق من تنبيهات الاختراق ذات الاحتمالية العالية.
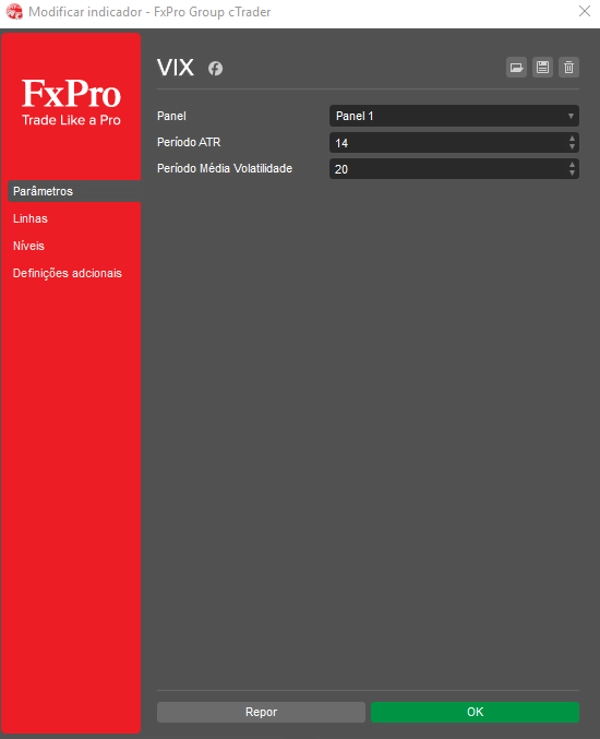
خصص إعداداتك لأقصى استفادة
قم بضبط المؤشر بسهولة ليتناسب مع استراتيجيتك التداولية عن طريق تعيين القيم المطلوبة لـ مستوى VIX المنخفض و مستوى VIX المرتفع كعتبات. بالإضافة إلى ذلك، قم بضبط عامل مقياس VIX للتحكم بدقة في ارتفاع وتصوير خط VIX في اللوحة السفلية.
كيفية قراءة إشارات الاختراق والتماسك
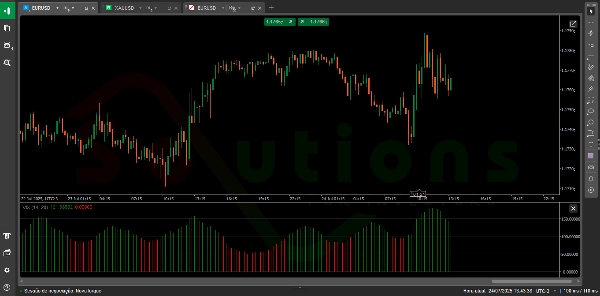
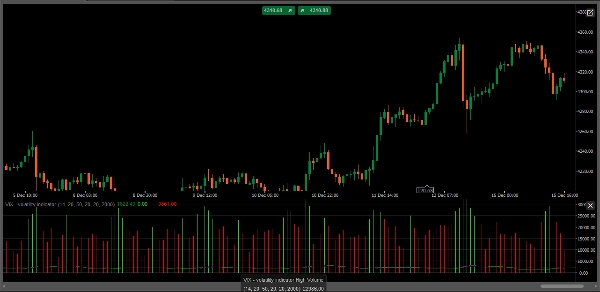
- تنبيه الاختراق (تقلب عالي): عندما يكسر خط VIX بقوة فوق مستوى VIX المرتفع و يصاحبه حجم مرتفع (مشيرًا إليه بواسطة مخطط الحجم العالي)، فهذا يؤكد الخوف/الجشع الشديد ويشير إلى اختراق سوقي عالي الاحتمالية.
- إشارة التماسك (تقلب منخفض): عندما ينخفض خط VIX تحت مستوى VIX المنخفض، غالبًا ما يشير ذلك إلى فترة هدوء السوق، تماسك ضيق، أو احتمال ارتداد متوسط — مثالي للتحضير لتحركك التالي أو تقليل المخاطر.
- رؤى الحجم: يرسم المؤشر مخططات الحجم العالي (أخضر) والحجم المنخفض (أحمر) في الخلفية، مما يتيح لك تقييم السيولة والقناعة وراء حركة السعر الحالية فورًا.
الملخص
ملخص الذكاء الاصطناعي
The VIX - Volatility Indicator is a proprietary tool designed for the cTrader platform (version 5.5.13 and above) that measures market volatility using an Average True Range (ATR)-based approach. It combines a scaled VIX line with tick volume data to provide dual confirmation of market conditions, helping traders identify potential breakouts and consolidation phases.
Key features include:
- ATR-based VIX calculation for responsive volatility measurement normalized to detect extreme market conditions.
- Volume analysis with high (green) and low (red) volume histograms to assess liquidity and conviction behind price movements.
- Customizable parameters allowing users to set Low VIX Level and High VIX Level thresholds, as well as adjust the VIX Scale Factor for optimal visualization.
Usage signals:
- A breakout alert occurs when the VIX line surpasses the High VIX Level accompanied by high volume, indicating potential market breakouts driven by extreme fear or greed.
- A consolidation signal is identified when the VIX falls below the Low VIX Level, suggesting periods of low volatility, market calm, or potential mean reversion.
This indicator supports analysis across various markets including Forex, indices, commodities, stocks, and cryptocurrencies.
ملف تعريف المؤشر
تقييمات العملاء
4.5
التقييمات: 2
5 | 50 % | |
4 | 50 % | |
3 | 0 % | |
2 | 0 % | |
1 | 0 % |
تقييمات العملاء
March 6, 2025
ngl, breaks are easier to judge and that is enough to keep testing it. It is not the whole trading plan.
February 28, 2025
reads better when the chart already supports the idea. Spread and slippage need a line in the notes.
مناقشة
الأسئلة الشائعة
BTCUSD
Forex
Signal
Breakout
Indices
EURUSD
Commodities
GBPUSD
NZDUSD
Prop
Crypto
Stocks
XAUUSD
NAS100
USDJPY
يتم توفير المنتجات المتاحة من خلال cTrader Store، بما في ذلك روبوتات التداول والمؤشرات والإضافات، من قبل مطوري الطرف الثالث وإتاحتها لأغراض الوصول المعلوماتي والفني فقط. cTrader Store ليس وسيطًا ولا يقدم نصائح استثمارية أو توصيات شخصية أو أي ضمان للأداء المستقبلي.


![شعار "[Stellar Strategies] Inside Bar with Signals"](https://cdn.ctrader.com/image/webp/1d9e8bfa-3b2c-4440-bb37-5856902008a7_30683)


السعر
منذ 05/02/2025
31
المبيعات