
Mô tả
📈 PineScriptLabs Tín hiệu Thông minh CDRC [Tự động TP/SL]
❓ Chỉ báo này là gì?
Hệ thống Kênh Đóng Cự Ly Động (CDRC) là một chỉ báo được phát triển dựa trên lý thuyết PineScriptLabs sử dụng hai kênh độc lập để tạo ra tín hiệu mua/bán 📊 và tự động tính toán mục tiêu lợi nhuận động (TP) và điểm dừng lỗ (SL) 🎯 mà không bao giờ giống nhau.
🎯 Thuật toán TP/SL Động Đặc biệt ⚡
Không giống các hệ thống sử dụng mức cố định hoặc ATR, thuật toán này tính toán TP và SL dựa trên biến động giá thực tế từ tín hiệu cuối cùng:
• Đối với LONG 📈: Đo khoảng cách từ giá thấp nhất ghi nhận được đến điểm vào lệnh, tính toán tỷ lệ phần trăm của biến động đó, và chiếu tỷ lệ phần trăm đó lên trên để thiết lập mục tiêu
• Đối với SHORT 📉: Đo khoảng cách từ giá cao nhất ghi nhận được đến điểm vào lệnh, và chiếu tỷ lệ phần trăm đó xuống dưới
🎯 Điều này có nghĩa mỗi giao dịch có các mức riêng biệt phù hợp với bối cảnh thị trường cụ thể tại thời điểm đó, phản ánh đà thực sự trước tín hiệu 💡
📊 Lý thuyết CDRC: Xây dựng Kênh 🏗️
Nền tảng Kỹ thuật 🔍
Lý thuyết CDRC xây dựng các kênh dựa hoàn toàn trên phạm vi giá đóng cửa, không dựa trên biến động hay độ lệch chuẩn. Giá đóng cửa đại diện cho sự đồng thuận thực sự của thị trường và loại bỏ nhiễu bóng nến 🎯
Quy trình Xây dựng ⚙️
- Giá Trung bình: Trung bình của tất cả các giá đóng cửa trong kỳ
- Phạm vi: Chênh lệch giữa giá đóng cửa cao nhất và thấp nhất của kỳ
- Biên độ: Phạm vi × Hệ số nhân ÷ 2
- Dải:
o Trên = Giá Trung bình + Biên độ ↗️
o Dưới = Giá Trung bình - Biên độ ↘️
🔄 Các kênh được tính lại trên mỗi thanh nến, liên tục thích nghi với thị trường
⚙️ Nó hoạt động như thế nào?
Hai Kênh Đồng thời 📊📊
• Kênh 1 (Nhanh - 111 thanh): Phản ứng nhanh với biến động, hệ số nhân 0.14 ⚡
• Kênh 2 (Chậm - 388 thanh): Tầm nhìn dài hạn, hệ số nhân 0.11 🐢
Tạo Tín hiệu 🎯
• LONG ✅: Giá đóng cửa trên dải trên của CẢ HAI kênh trong 2 thanh liên tiếp 🟢
• SHORT ✅: Giá đóng cửa dưới dải dưới của CẢ HAI kênh trong 2 thanh liên tiếp 🔴
🛡️ Xác nhận kép lọc tín hiệu sai
🤖 Tính toán TP/SL Tự động (Chi tiết Thuật toán)
Đối với LONG 📈:
- Hệ thống liên tục ghi lại giá thấp nhất kể từ tín hiệu cuối
- Khi tạo tín hiệu mua, tính toán: Tỷ lệ phần trăm = (Giá vào lệnh - Giá thấp nhất) / Giá vào lệnh × 100
- Chiếu tỷ lệ phần trăm đó lên trên từ điểm vào lệnh để thiết lập TP3
- Chia phạm vi thành ba vùng: TP1 (33%), TP2 (66%), TP3 (100%)
- SL = Điểm vào lệnh - (Điểm vào lệnh × Tỷ lệ phần trăm × Tỷ lệ dừng lỗ / 100)
Đối với SHORT 📉:
- Hệ thống liên tục ghi lại giá cao nhất kể từ tín hiệu cuối
- Khi tạo tín hiệu bán, tính toán: Tỷ lệ phần trăm = (Giá cao nhất - Giá vào lệnh) / Giá vào lệnh × 100
- Chiếu tỷ lệ phần trăm đó xuống dưới từ điểm vào lệnh để thiết lập TP3
- Chia phạm vi thành ba vùng tiến triển
- SL = Điểm vào lệnh + (Điểm vào lệnh × Tỷ lệ phần trăm × Tỷ lệ dừng lỗ / 100)
🎯 Kết quả: Mỗi giao dịch có các mức riêng biệt được tính toán theo đà thị trường cụ thể tại thời điểm đó
👀 Trực quan hóa 🎨
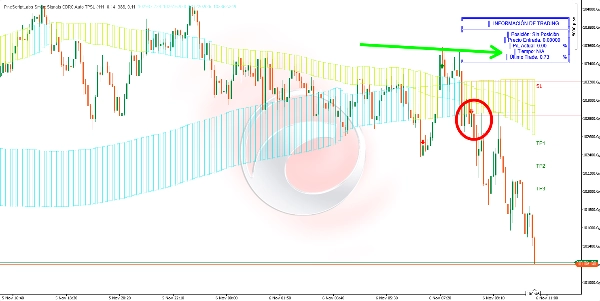
• Điểm: Dải của cả hai kênh
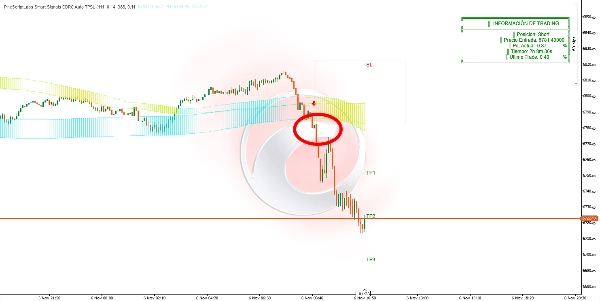
• Tô màu động: Kênh đổi màu khi bị xuyên thủng
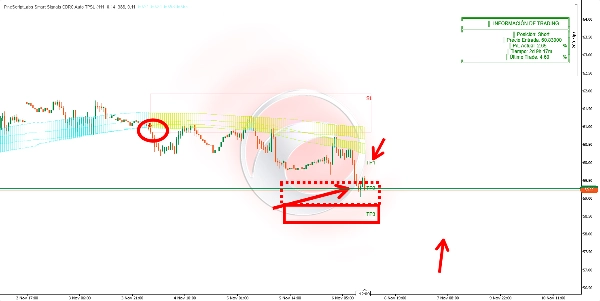
• Hộp: Vùng vào lệnh (SL-Entry) và ba vùng mục tiêu (độ trong suốt tăng dần)
• Nhãn: SL, TP1, TP2, TP3 với giá chính xác 🏷️
• Mũi tên: Xanh (mua) 🟢 / Đỏ (bán) 🔴
• Bảng: Vị trí hiện tại, Giá vào lệnh, % Lãi/Lỗ hiện tại, Thời gian giao dịch, Giao dịch đóng cuối cùng 📋
🎯 Nó dùng để làm gì?
- Vào lệnh với xác suất cao với xác nhận khung thời gian kép ✅
- Quản lý rủi ro tự động thích ứng dựa trên biến động thị trường thực tế 🤖
- Mục tiêu phân tầng độc đáo cho mỗi giao dịch theo đà trước đó 🎯
- Thích ứng động với hành vi giá gần đây 🔄
- Giám sát thời gian thực hiệu suất vị trí 📊
🛠️ Cách sử dụng?
Vào lệnh 🚀: Vào lệnh khi đóng thanh nến có mũi tên xuất hiện
Quản lý 💼:
• TP1: 33% chuyển động dự kiến (chốt lời một phần) 💰
• TP2: 66% chuyển động (lợi nhuận nhiều hơn) 💰💰
• TP3: 100% chuyển động (mục tiêu cuối cùng) 🎯
• SL: Luôn tuân thủ điểm dừng lỗ tự động ⛔
Giám sát 👀: Bảng hiển thị P/L hiện tại theo thời gian thực. Hệ thống tự động phát hiện khi đạt TP3 hoặc SL. Chỉ có một tín hiệu hoạt động tại một thời điểm ⚠️
⚙️ Tham số và Tác động
Chu kỳ Kênh 1 (111):
• ↑ Nhiều thanh hơn = Ít tín hiệu hơn, đáng tin cậy hơn, chậm hơn 🐢
• ↓ Ít thanh hơn = Nhiều tín hiệu hơn, nhanh hơn, nhạy cảm hơn ⚡
Hệ số nhân Kênh 1 (0.14):
• ↑ Cao hơn = Dải rộng, ít tín hiệu, chỉ các biến động mạnh 💪
• ↓ Thấp hơn = Dải hẹp, nhiều tín hiệu hơn, nhạy cảm hơn 🎯
Chu kỳ Kênh 2 (388):
• ↑ Cao hơn = Xác nhận nghiêm ngặt, ít tín hiệu 🛡️
• ↓ Thấp hơn = Nhiều tín hiệu hơn, lọc ít hơn 📊
Hệ số nhân Kênh 2 (0.11):
• ↑ Cao hơn = Lọc nghiêm ngặt, thận trọng 🎯
• ↓ Thấp hơn = Nhạy cảm hơn, nhiều giao dịch hơn ⚡
Tỷ lệ Dừng lỗ (50%):
• 50% = Tỷ lệ 1:2 (cân bằng chuyên nghiệp: rủi ro 1, lợi nhuận 2) ⚖️
• ↑ Hướng về 100% = SL rộng, rủi ro cao hơn, ít bị dừng lỗ, tỷ lệ R:R kém hơn 📉
• ↓ Hướng về 1% = SL chặt, rủi ro thấp hơn, tỷ lệ R:R tốt hơn, nhiều bị dừng lỗ hơn 📈
🔑 Những lưu ý chính
• Bộ nhớ thị trường 🧠: Ghi lại các mức giá cực đoan từ tín hiệu cuối để dự báo thực tế và độc đáo
• TP/SL không bao giờ bằng nhau ⚖️: Mỗi giao dịch có các mức được tính toán theo bối cảnh cụ thể
• Bắt buộc xác nhận kép trong 2 thanh liên tiếp ✅✅
• Chỉ có một tín hiệu hoạt động tại một thời điểm ⚠️
• Các kênh liên tục tính lại thích nghi với thị trường 🔄
• Hộp mở rộng trực quan để duy trì khả năng quan sát 👀
🚀 Hơn 10.000 nhà giao dịch đã sử dụng các chỉ báo hàng đầu🏆 của chúng tôi
👉 Nhận tất cả các hệ thống hàng đầu của chúng tôi tại đây:
_______________________________________________
📌 Chỉ báo Cấu trúc Thị trường
· ✅ AdvancedMarket Structure: Bos, Choch, SwinLevels, Order Blocks, Market Structure& Liquidity Finder
· 🔄 Dynamic Market StructureAnalysis of Turning Points
· 🧱 Order Block
· ⚖️ Market Imbalance
· ⛓️ BOS & CHOCH
· 🧠 ICT Power of 3
_______________________________________________
🔚 Hệ thống Thoát Thông minh
· 📍 Thuật toán Thông minh Theo dõi
_______________________________________________
📐 Chỉ báo ZigZag
· 🔍 ZigZag Price LiquidityProjection
· ➖ ZigZag
_______________________________________________
🧱 Chỉ báo Hỗ trợ & Kháng cự
· 🟩 SmartTrend Support &Resistance Lines
· 🧱 All Support and ResistanceLevels
_______________________________________________
📊 Chỉ báo Xu hướng & Kênh
· 📊 Supertrend
_______________________________________________
💧 Công cụ Khối lượng & Thanh khoản
_______________________________________________
⚡ Chỉ báo Đà & RSI
· 🔎 Multi-Level Candle Bias
Tracker
_______________________________________________
🔮 Công cụ Dự đoán & Chiếu dự báo
· 📐 Dự đoán dựa trên Linreg& ATR
· 📏 Fibonacci Linear RegressionMulti-timeframe
· 📈 Volume-Powered Market Flow Projector
Tóm tắt
Đánh giá của khách hàng
5 | 67 % | |
4 | 0 % | |
3 | 33 % | |
2 | 0 % | |
1 | 0 % |


![Logo "High-Low Divergence [Iridio Capital]"](https://cdn.ctrader.com/image/webp/443c4661-7abb-40f1-842f-4b6ec560649b_40914)


