

Описание
🚀 Более 10 000 трейдеров уже используют наши ТОП индикаторы🏆
Узнайте, почему профессионалы выбирают нас – самые мощные инструменты на cTrader (индикаторы, алгоритмы и cBots) ждут вас.
👉 Получите все наши ТОП-системы здесь:
_______________________________________________
_______________________________________________
📌 Индикаторы структуры рынка
· ✅ AdvancedMarket Structure: Bos, Choch, SwinLevels, Order Blocks, Market Structure& Liquidity Finder
· 🔄 Динамический анализ структуры рынка точек разворота
· 🧱 Order Block
· ⚖️ Дисбаланс рынка
· ⛓️ BOS & CHOCH
· 🧠 ICT Power of 3
______________________________________________________________-
Магазин cBots : 🧠 Gold & BTC BreakoutSession Pivots 🧠
_______________________________________________
🔚 Системы умного выхода
_______________________________________________
📐 Индикаторы ZigZag
· 🔍 Проекция ликвидности цены ZigZag
· ➖ ZigZag
· 🎯 Трекер экстремумов Zig-Zag
_______________________________________________
🧱 Индикаторы поддержки и сопротивления
· 🟩 SmartTrend линии поддержки и сопротивления
· 🧱 Все уровни поддержки и сопротивления
_______________________________________________
📊 Индикаторы тренда и каналов
· 🔄 Авто-тренд канал
· 📊 Супертренд
· 🌈 Динамический градиент тренда
· 🔁 Реактивная скользящая средняя
_______________________________________________
💧 Инструменты объема и ликвидности
· 📉 Карта ликвидаций с кредитным плечом
· 🔍 Разрыв справедливой стоимости Momentum
· 🕒 Сессии разрыва справедливой стоимости
_______________________________________________
⚡ Индикаторы Momentum и RSI
· 🚀 Динамический диапазон Momentum
· 🔎 Многоуровневый трекер свечного смещения
_______________________________________________
🔮 Инструменты прогнозирования и проекции
· 📐 Прогноз на основе линейной регрессии и ATR
· 📏 Фибоначчи линейная регрессия мультивременных рамок
· 📈 Проектор рыночного потока на основе объема
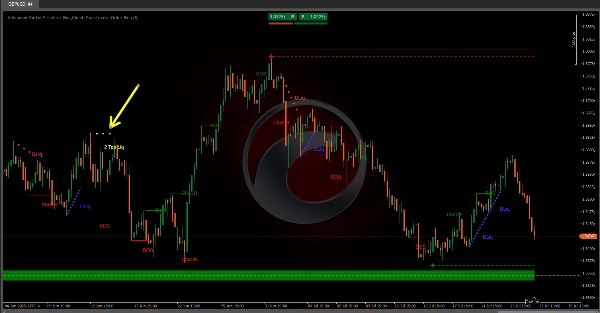
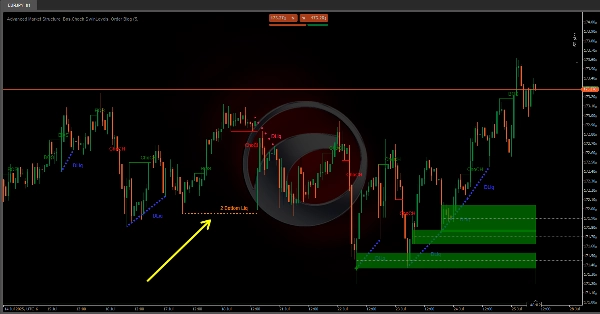
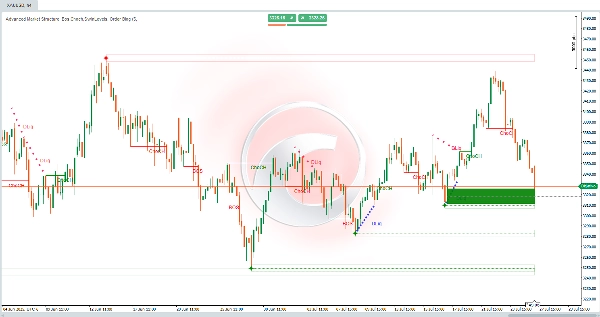
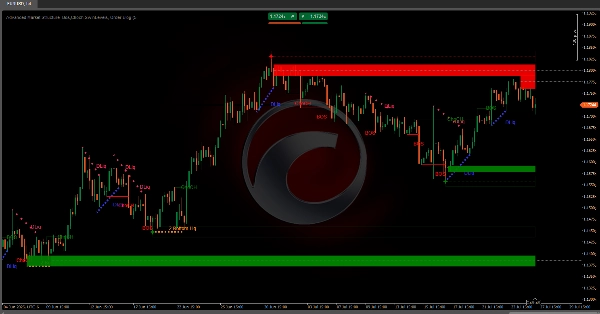
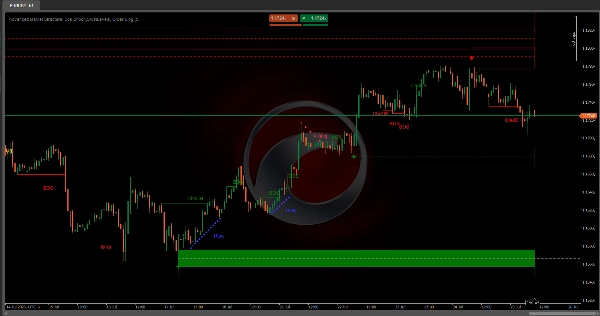
Advanced Market Structure: Bos, Choch, SwinLevels, Order Blocks, Market Structure & Liquidity Finder.
Что это?
Это продвинутый инструмент анализа ценового действия, который объединяет несколько концепций технического анализа в один мощный индикатор. Интегрирует:
- 📊 Структуру рынка
- 🔄 Swing уровни
- 🧱 Order Blocks
- 💧 Liquidity Finder (2 минимума и 2 максимума)
Цель: Определить ключевые точки входа/выхода, тренды, уровни поддержки/сопротивления и институциональные зоны, где цена реагирует.
🧠 Основная философия: Умные деньги
Рынки движимы институциональными игроками (банки, фонды, маркет-мейкеры) с превосходными ресурсами. Они создают паттерны для:
- 🕵️♂️ Сокрытия операций во время накопления/распределения.
- 🎯 Охоты за ликвидностью (стоп-лоссы розничных трейдеров).
- 🚀 Подпитки взрывных движений на несбалансированных рынках.
🔑 Компоненты:
1. Order Blocks
- Что это: Зоны, где институты исполняли крупные ордера, создавая дисбалансы.
- Типы:
-
- 🟢 Бычьи (Спрос): Агрессивные институциональные покупки.
- 🔴 Медвежьи (Предложение): Агрессивные институциональные продажи.
- Ключевой сигнал: Отскок/разворот цены на order blocks.
- Обнаружение:
-
- Всплески объема возле максимумов (медвежьи) или минимумов (бычьи).
2. Swing Levels
- Назначение: Определять структуру рынка через ключевые максимумы/минимумы.
- Критические пробои:
-
- 🔺 Пробой Swing High: Продолжение бычьего тренда.
- 🔻 Пробой Swing Low: Продолжение медвежьего тренда.
3. Пробой структуры (BoS)
- Определение: Решительный пробой swing максимумов (бычий) или минимумов (медвежий).
- Связь с фракталами:
-
- 🐂 Бычий фрактал: Паттерн из 5 свечей с центральным самым низким минимумом.
- 🐻 Медвежий фрактал: Паттерн из 5 свечей с центральным самым высоким максимумом.
4. Изменение характера (ChoCh)
- Определение: Структурный сдвиг, сигнализирующий о развороте тренда.
- Триггеры:
-
- Пробой swing минимумов в восходящем тренде (медвежий ChoCh).
- Пробой swing максимумов в нисходящем тренде (бычий ChoCh).
5. Зоны ликвидности
- Типы:
-
- ⚖️ Статические: Горизонтальные уровни с кластеризацией максимумов/минимумов (фильтр ATR).
- 🏃 Динамические: Трендовые линии, соединяющие крутые повороты.
- Ключевые паттерны:
-
- 🕯️ 2 максимума/2 минимума: Институциональные охоты за стопами.
- ⛰️ Тройные максимумы/минимумы: Зоны высокой концентрации.
🎯 Ключевые применения
- ✅ Определение трендов/разворотов через BoS/ChoCh.
- 📍 Поиск поддержки/сопротивления с помощью swing уровней и зон ликвидности.
- 🏦 Обнаружение институциональных order blocks.
- 🎯 Прогнозирование ценовых целей через зоны ликвидности.
🔄 Стратегии умных денег
ФазыСигналыИнституциональные действия
1. Накопление
Бычий ChoCh + блок спроса 📈
Умные деньги покупают
2. Рост
Последовательные BoS + разрывы FVG 🚀
Розничные трейдеры подпитывают импульс
3. Распределение
Медвежий ChoCh на ликвидности 2 максимумов 🎯
Умные деньги продают
4. Падение
Медвежий BoS + ликвидация зоны скидок 🔻
Охота на стопы на минимумах
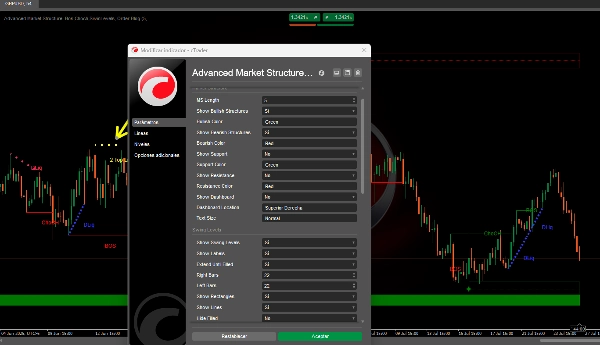
⚙️ Руководство по настройке параметров
Структура рынка
Длина MS:-
- ⬆️ Увеличить: Меньше, но более надежных фракталов.
- ⬇️ Уменьшить: Более чувствительно (риск шума).
Swing уровни
Размер Swing L/R:-
- ⬆️ Увеличить: Определяет значимые колебания.
- ⬇️ Уменьшить: Фиксирует мелкие развороты.
Продлевать до заполнения:-
- ✅ Включено: Уровни сохраняются, пока цена их не достигнет.
Order Blocks
Метод смягчения:-
- ✨
Верхушка свечи: Быстрые сигналы (касание верхушки). - 🎯
Закрытие: Более сильные сигналы (закрытие за пределами блока).
- ✨
Liquidity Finder
Чувствительность статическая/динамическая:-
- ⬆️ Увеличить: Меньше зон (высокое качество).
- ⬇️ Уменьшить: Больше зон (высокая чувствительность).
Сводка
Key components include:
- **Order Blocks:** Zones of significant institutional buying (bullish) or selling (bearish) identified by volume spikes near highs or lows, signaling potential price rebounds or reversals.
- **Swing Levels:** Critical highs and lows defining market structure, with breaks indicating bullish or bearish continuations.
- **Break of Structure (BoS):** Decisive breaks of swing highs or lows, linked to fractal patterns, signaling trend direction.
- **Change of Character (ChoCh):** Structural shifts indicating trend reversals, triggered by breaking swing lows in uptrends or swing highs in downtrends.
- **Liquidity Zones:** Static (horizontal levels with clustered highs/lows) and dynamic (trendlines connecting pivots) zones highlighting institutional stop hunts and congestion areas.
The indicator supports smart money concepts, reflecting institutional market behavior phases: Accumulation, Markup, Distribution, and Markdown. Parameter tuning options allow adjustment of sensitivity and signal strength for Market Structure, Swing Levels, Order Blocks, and Liquidity Finder components. This tool aims to enhance market analysis by revealing institutional activity and improving trade decision-making.
Отзывы покупателей
5 | 25 % | |
4 | 50 % | |
3 | 25 % | |
2 | 0 % | |
1 | 0 % |






























