present
Registrati e ricevi uno sconto da $50 sul tuo primo acquisto
Trading product for PulseFlow Daily Targets Indicatore Key Levels Market Structure, image 1
PulseFlow Daily Targets
Indicatore
Versione 1.0, Oct 2026
Windows, Mac
Trading product for PulseFlow Daily Targets Indicatore Key Levels Market Structure, image 2
Trading product for PulseFlow Daily Targets Indicatore Key Levels Market Structure, image 3
Trading product for PulseFlow Daily Targets Indicatore Key Levels Market Structure, image 4
Da 14/10/2026

Descrizione

Launch price: $19 until November 14, 2026. After that date, the price returns to $33.

Every trading day opens with a map


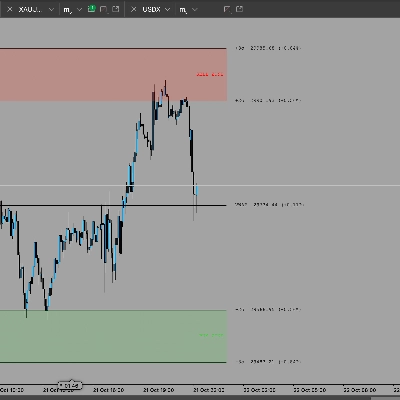
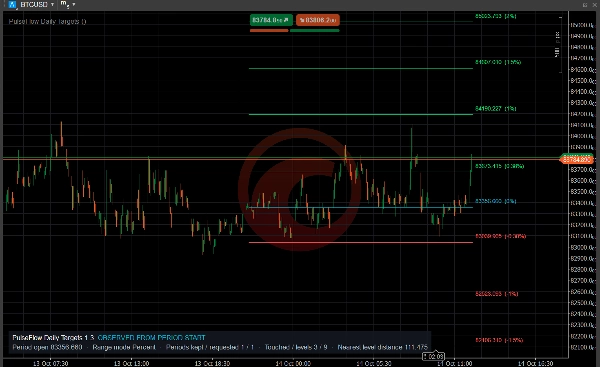
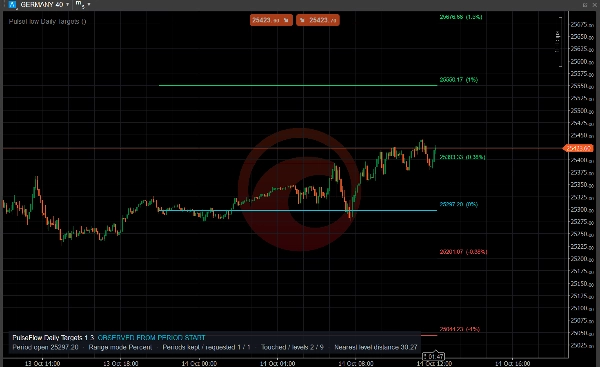
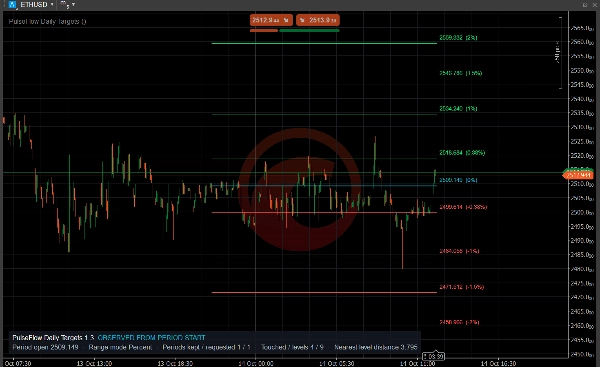
PulseFlow Daily Targets draws the day's percentage targets from the opening price. From the first candle you know how far the session has travelled and which level comes next. It helps you make better decisions with clear references.


Why these levels

The opening price is the first price of the day. Many traders measure the session in percentages from it, such as plus 1% or minus 1.5%, and use those distances as targets to take profits, adjust positions and manage risk. That is why these levels are worth keeping in view.


What you get

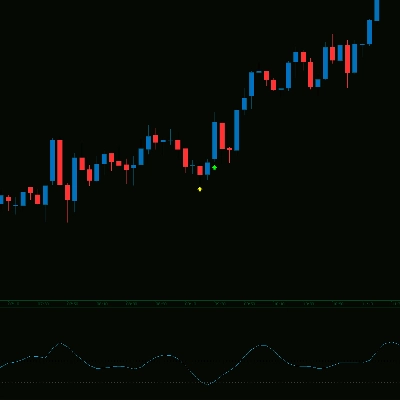
- An aqua line at the day open, four green levels above it and four red below. By default they sit at ±0.38%, ±1%, ±1.5% and ±2%, and all four distances are configurable to fit your asset and its volatility.

- Spacing in percent, or as a multiple of the daily ATR or ADR. Reference: the day open or the previous close.

- Price labels in the color of their line, with no boxes covering your candles, so you read the exact price of every level.

- Optional fading of levels after their first touch, and a compact panel with the reference, levels touched and the distance to the nearest level.

- Optional cTrader pop-up alerts on the first touch of an upper or lower level.


A fresh map each day

Each trading day the indicator takes the new open and calculates a new set of levels. The lines grow with each candle and stop when the day ends, so one day never ties into the next. By default only today's levels are shown; keep up to 50 previous days to compare.


Picture the session

Price opens, climbs and stalls at the first green line. Does it reject the level or accept it and keep going? You watch a level that matters, see how far the session has travelled and where it meets structure, VWAP, volume, support or resistance.


Type, instruments and timeframes

Chart overlay indicator for intraday support and resistance levels. It is designed mainly for cryptocurrencies on intraday charts, especially the 5-minute chart, and it also works on other markets such as stock indices. Intraday and daily charts are supported.


These levels are references, not automatic entries or exits. Trading involves risk. Past performance does not guarantee future results.


Riepilogo

Profilo indicatore
Categoria indicatore
Supporto e resistenza
Tipo di output
Visualizzazione
Requisiti per i dati
Solo barre
Segnali supportati
Livello raggiunto

Discussioni

Recensioni dei clienti

0.0
Recensioni: 0
Recensioni dei clienti
Questo prodotto non ha ancora ricevuto recensioni. L'hai già provato? Fallo sapere agli altri per primo!

Domande frequenti

Key Levels
Market Structure
Support & Resistance
I prodotti disponibili tramite cTrader Store, inclusi bot di trading, indicatori e plugin, sono forniti da sviluppatori terzi e resi disponibili esclusivamente a scopo informativo e di accesso tecnico. cTrader Store non è un broker e non fornisce consulenze in materia di investimento, raccomandazioni individualizzate o garanzie di risultati futuri.

Altro da questo autore

Indicatore
RSI
Fibonacci
+1
Spot RSI divergences on your chart and get an entry, stop and six targets when your filters line up.
Indicatore
Imbalance
Key Levels
+1
Keep open imbalance zones, untouched session highs and lows and the day's ADR range in view, without scrolling back.
Indicatore
Key Levels
Support & Resistance
Add your provider's gamma levels by hand or automatically with our feed plugin, and see the gamma regime at a glance.
Plugin per desktop
External Data
HTTP Requests
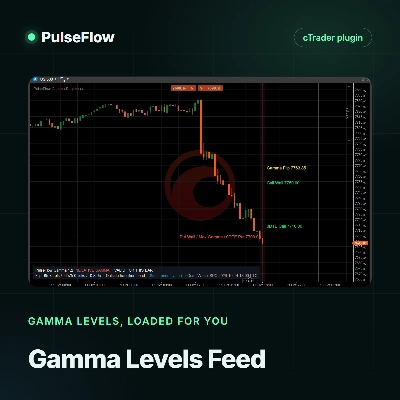
Load live gamma levels from your own QuantWheel API key into PulseFlow Gamma Regime, with no more typing by hand.

Potrebbe interessarti anche

Indicatore
Smoothed CCI alerts! Audio & arrow signals for +/-100 crosses. Custom sounds & arrow filters. Precision trading!
Indicatore
AI
ATR
+26
Exploit market imbalances with auto FVG zones—fade, extend, and filter with precision.
Indicatore
ATR
MSS
+5
Advanced market structure and institutional cycle mapper with visual reference cards and entry alerts
Indicatore
Forex
EURUSD
+4
A precision overlay tool that combines session-aware VWAP logic and standard deviations.
Indicatore
ATR
RSI
+6
💹 Define a price channel 📈 and determine trend direction (bullish 🟢 or bearish 🔴).
Indicatore
Forex
GBPUSD
+5
Visual warning zones for high-impact news so you can manage risk before volatility hits.
Indicatore
AI
ATR
+26
Liquidity Cluster Order automatically detects and draws accumulation zones & distribution zones
Indicatore
Forex
BTCUSD
+5
Simple ICT Concepts
Indicatore
RSI
Fibonacci
+1
Spot RSI divergences on your chart and get an entry, stop and six targets when your filters line up.
Indicatore
VWAP
Support & Resistance
Trading.FC$_vwap Algo shows VWAP trends, dynamic support/resistance and deviation bands to spot potential trade entries.
Indicatore
SMC
Forex
+13
MultiFrameCandles para cTrader: La Herramienta Definitiva para Dominar Cualquier Marco de Tiempo
Indicatore
Prop
Forex
+5
Pivot Point with base zone daily Asia-London-New york Session.
Indicatore
Prop
Forex
+12
⚡ ADXVMA Aurora Trend Filter combines ADX trend strength with an adaptive EMA blend ⚡
Indicatore
BOS
EMA
+5
VWAP Bands indicator with 3 standard deviation levels, buy/sell zones, and a draggable ON/OFF button to toggle the entir
Indicatore
Candle Timer & Strength Panel for cTrader Description: Candle Timer & Strength Panel is an advanced, always-visible over
Indicatore
RSI
Breakout
+1
Dynamically adjusts regression channels based on ZigZag extremes, resetting when price breaks bands to track real trends
Indicatore
SMC
Prop
+17
Unlock the true intent of market participants with the Classic Proportional Cumulative Volume Delta CVD!
Indicatore
SMC
Prop
+11
Sessions PRO is a professional session visualization indicator - 4 Fully Customizable Sessions

Prezzo

Da 14/10/2026