Beschreibung
Pinescriptlabs Store Indikatoren: Pinescriptlabs Store cBots : (cBot) Gold & BTC BreakoutSession Pivots(neu)
Erweiterte Marktstruktur: Bos, Choch, SwinLevels, Order Blocks, Marktstruktur & Liquiditätsfinder (Neu)
ZigZag Preis-Liquiditätsprojektion
Trailing Smart Algorithmus (neu)
Vorhersage basierend auf Linreg & ATR
SmartTrend Unterstützung &
Widerstand
Linien
Dynamische
Marktstruktur
Analyse
von
Wendepunkten
Punkten
Fibonacci
Lineare
Regression
Multi-Zeitrahmen
Mehrstufiger
Kerzen-Bias
Tracker
Reaktive gleitende Durchschnitt
Auto
Unterstützung und
Widerstand
Trend
Linien
Alle
Unterstützungs- und
Widerstandsniveaus
Levels
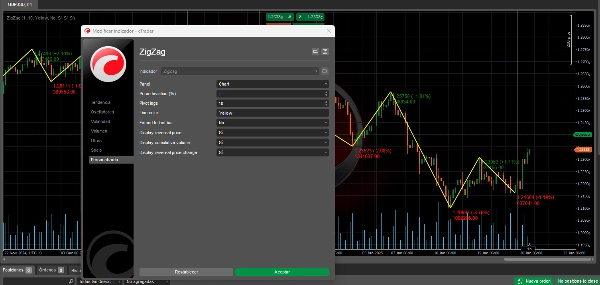
Der ZigZag-Indikator: Vereinfachung von Markttrends 📉📈
Der ZigZag ist ein technischer Indikator, der hilft, signifikante Trendwechsel eines Assets zu identifizieren, indem er kleinere Marktbewegungen herausfiltert. Sein Hauptzweck ist es, die visuelle Preisanalyse zu vereinfachen, indem das „Rauschen“ kleiner Schwankungen eliminiert wird.
Wie es funktioniert ⚙️
- 📊 Analysiert Preise, um bedeutende Wendepunkte (Pivots) zu finden.
- 📈 Ein Wendepunkt gilt als bedeutend, wenn sich der Preis um einen bestimmten Mindestprozentsatz (Abweichungsparameter) ändert.
- 🔗 Verbindet diese Wendepunkte mit geraden Linien und bildet so ein „Zickzack“-Muster.
- 🕒 Aktualisiert sich dynamisch, wenn neue Preisdaten eintreffen.
Handelsnützlichkeit 💡
Trendidentifikation 📐
- 🔍 Hilft, die primäre Marktrichtung zu visualisieren.
- 🚀 Erleichtert das Erkennen von bullischen und bärischen Trends.
- 📏 Hebt klar wichtige Unterstützungs- und Widerstandsniveaus hervor.
Musteranalyse 📋
- 🎯 Vereinfacht die Identifikation von Chartmustern.
- 🕵️♂️ Hebt Preisformationen wie Dreiecke, Flaggen und andere Muster hervor.
- 🌊 Verbessert die Klarheit bei der Erkennung von Elliott-Wellen.
Trade-Management 🎛️
- 🎯 Identifiziert potenzielle Ein- und Ausstiegspunkte.
- 🛡️ Hilft bei der Bestimmung von Stop-Loss-Niveaus basierend auf vorherigen Pivots.
- 🎯 Erleichtert das Setzen realistischer Kursziele.
Volatilitätsanalyse 🌡️
- 📏 Der Abstand zwischen den Pivots spiegelt die Marktvolatilität wider.
- 🧩 Hilft, Strategien entsprechend der Größe der Bewegungen anzupassen.
- ⏳ Unterscheidet zwischen Konsolidierungsphasen und Richtungsbewegungen.
Signalbestätigung ✅
- 🔍 Dient als Bestätigungstool für andere Indikatoren.
- 🚪 Validiert Ausbrüche wichtiger Niveaus.
- 🔗 Kann mit anderen Indikatoren für robustere Strategien kombiniert werden.
Wichtige Überlegungen 🧠
Es ist retrospektiv 📅
- ⏪ Wendepunkte werden erst bestätigt, nachdem die Bewegung stattgefunden hat.
- 🔮 Es ist für sich genommen nicht vorhersagend.
- ⚖️ Sollte in Kombination mit anderen Indikatoren für Entscheidungen verwendet werden.
Parameteranpassungen 🔧
- 🎚️ Die Sensitivität hängt vom eingestellten Abweichungsprozentsatz ab.
- 🔍 Ein kleinerer Prozentsatz zeigt mehr Wendepunkte an.
- 🧹 Ein höherer Prozentsatz filtert kleinere Bewegungen heraus und zeigt nur signifikante Veränderungen.
Zeitrahmen-Nutzung 🕒
- 🕰️ Funktioniert in jedem Zeitrahmen.
- 🔄 Parameter sollten basierend auf Handelszeithorizonten angepasst werden.
- 🌐 Die Analyse über mehrere Zeitrahmen hinweg bietet eine umfassendere Sicht.
📈 Nutzen Sie den ZigZag-Indikator als kraftvolles Werkzeug, um die Analyse zu vereinfachen, Trends zu erkennen und Ihre Entscheidungsfindung im Trading zu verbessern! 🚀
Zusammenfassung
Key functionalities include:
- Trend Identification: Visualizes primary market direction, highlights bullish and bearish trends, and marks key support and resistance levels.
- Pattern Analysis: Simplifies recognition of chart patterns such as triangles, flags, and Elliott waves.
- Trade Management: Assists in identifying entry and exit points, setting stop-loss levels based on previous pivots, and establishing realistic price targets.
- Volatility Analysis: Reflects market volatility through pivot distances, aiding strategy adjustments and distinguishing consolidation from trending phases.
- Signal Confirmation: Validates breakouts and complements other indicators for robust trading strategies.
The indicator is retrospective, confirming pivots only after price movements occur, and is not predictive on its own. Sensitivity can be adjusted via the deviation percentage to show more or fewer pivot points. It is compatible with any timeframe and benefits from multi-timeframe analysis for comprehensive market views.
This tool supports analysis across various markets including cryptocurrencies (BTCUSD), commodities (XAUUSD), and others, and integrates with related indicators like RSI, ATR, and Supertrend.
Kundenbewertungen
5 | 50 % | |
4 | 33 % | |
3 | 17 % | |
2 | 0 % | |
1 | 0 % |