설명
Pinescritlabs Ctrader Store 지표 :
Dynamic Market Structure
전환점 분석
Multi-Level Candle Bias
Tracker
Auto Support and
Resistance Trend Lines
All Support and
Resistance Levels
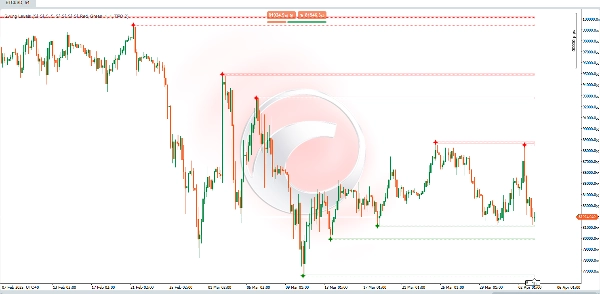
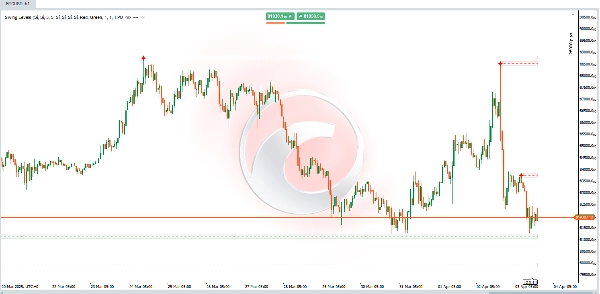
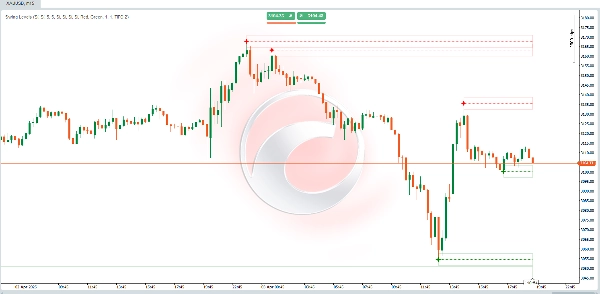
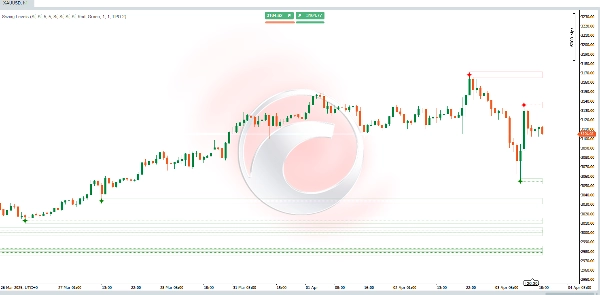
🔍 스윙 레벨
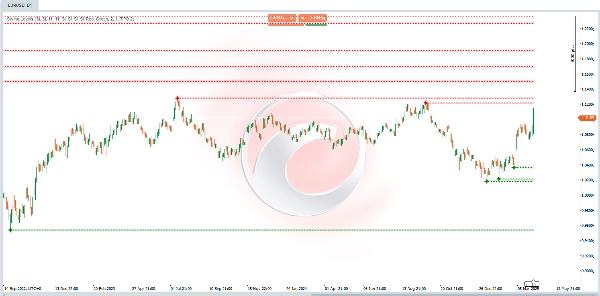
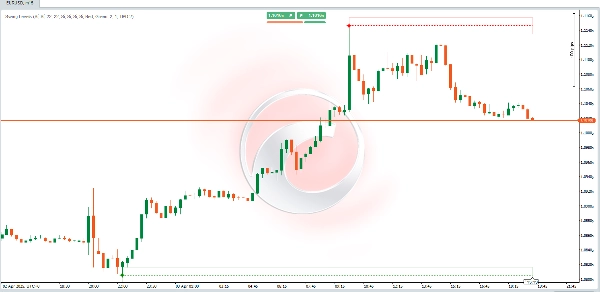
이 지표는 차트의 "스윙" 또는 피벗(즉, 중요한 고점과 저점)을 기반으로 자동으로 지지 및 저항 레벨을 감지하도록 설계되었습니다. 이러한 지점이 식별되면, 가격 움직임과 거래 결정에 중요한 참조가 되는 선 또는 영역(사각형)을 그립니다.
🛠 주요 특징:
✅ 핵심 레벨 식별: 최신 스윙 고점과 스윙 저점이 형성된 위치를 강조합니다. 이러한 레벨은 종종 미래에 지지 또는 저항 역할을 합니다.
✅ 시장 구조 분석: 시장이 더 높은 고점과 더 높은 저점(강세) 또는 더 낮은 고점과 더 낮은 저점(약세)을 형성하는지 시각화하는 데 도움을 줍니다—추세 식별과 잠재적 반전 지점에 필수적입니다.
✅ 의사 결정 도구: 거래자는 이러한 레벨을 사용하여 진입점, 손절매 위치 또는 이익 실현 구역을 결정할 수 있으며, 동적인 지지와 저항을 활용할 수 있습니다.
🧠 작동 원리:
1️⃣ 피벗 감지 (스윙 고점 & 스윙 저점)
📌 이 지표는 정의된 수의 캔들/바를 왼쪽과 오른쪽(매개변수: "Left Bars" & "Right Bars") 분석합니다.
📌 스윙 고점을 감지하기 위해, 중앙 바(잠재적 피벗)의 고점이 범위 내 이웃 바들의 고점보다 높은지 확인합니다.
📌 스윙 저점을 감지하기 위해, 동일한 논리를 적용하지만 대신 저점을 비교합니다.
📊 그려진 레벨 해석:
🔴 스윙 고점 → 잠재적 저항 구역:
- 가격이 이 레벨로 돌아오면, 거부(매도) 또는 돌파(강세 지속)를 주시하세요.
🟢 스윙 저점 → 잠재적 지지 구역:
- 가격이 이 레벨을 다시 방문하면, 반등(매수) 또는 붕괴(약세 지속)를 관찰하세요.
요약
Key features include:
- Identification of recent swing highs and lows, which often act as future support or resistance.
- Visualization of market structure by highlighting patterns of higher highs and lows (bullish) or lower highs and lows (bearish), aiding trend recognition and reversal detection.
- A decision-making tool for traders to set entry points, stop-losses, and take-profit zones based on dynamic support and resistance.
Swing highs indicate potential resistance zones where price may reject or break out, while swing lows indicate potential support zones where price may bounce or break down. This indicator supports analysis across various markets and timeframes by providing clear visual cues of market turning points.
고객 리뷰
5 | 0 % | |
4 | 100 % | |
3 | 0 % | |
2 | 0 % | |
1 | 0 % |


!["Tabajara corrigido[fix]" 로고](https://cdn.ctrader.com/image/webp/7f4bbef8-b245-4ebd-80d7-582fffc0c90c_28378)