
설명
🌟 MA Quant Volume Profile V2.0 미래 지향 에디션
전문 트레이더를 위한 혁신적인 시장 분석 도구
🚀 V2.0 신제품 - 미래 지향 에디션
혁신적인 인터페이스
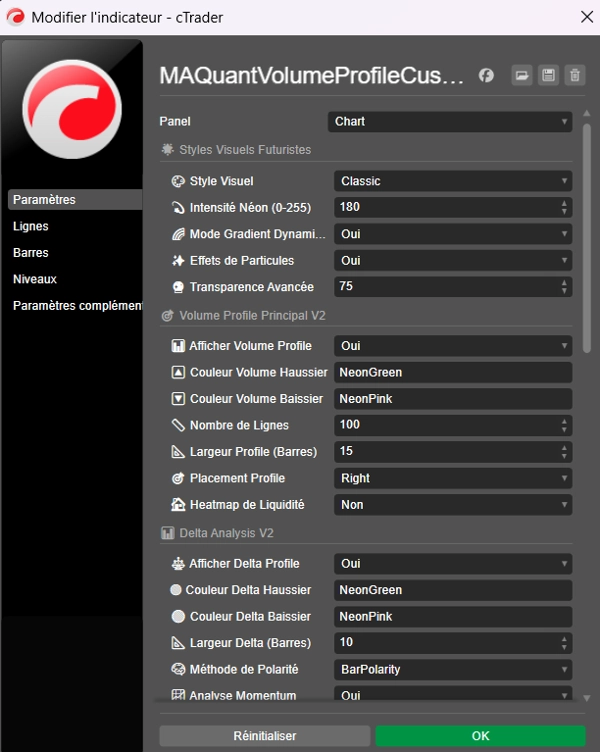
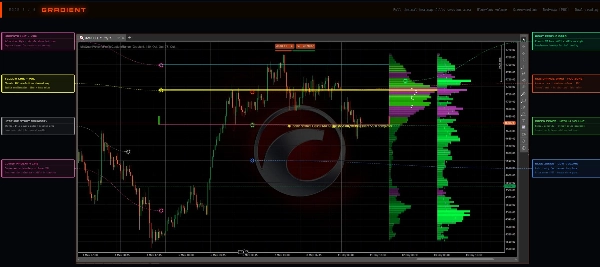
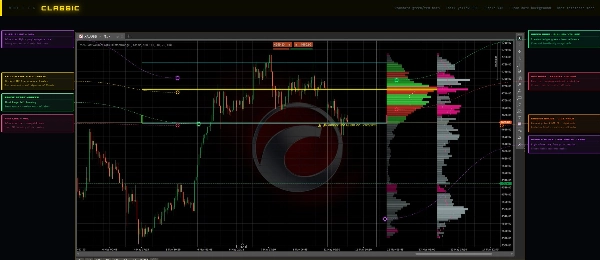
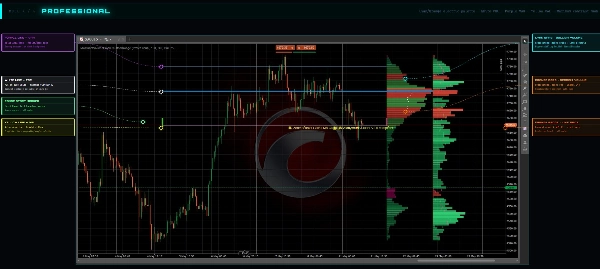
- 🎨 5가지 미래 지향적 시각 스타일: 미래 지향, 네온, 프로페셔널, 그라데이션, 클래식
- ⚡ 동적 네온 효과: 고급 투명도와 함께 조절 가능한 강도 (50-255)
- 🌈 애니메이션 그라데이션: 부드러운 전환과 사이버펑크 색상
- ✨ 입자 효과: 애니메이션이 포함된 대량 시각화
- 🔮 홀로그램 인터페이스: 지능형 실시간 제어판
고급 기관 분석
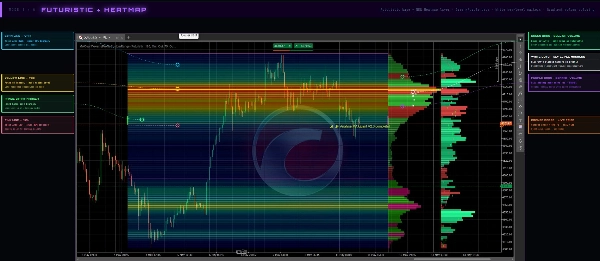
- 📊 유동성 히트맵: 고활동 구역의 열 시각화
- ⚖️ 전문 델타 분석: 실시간 매수/매도 심리
- 📈 통합 모멘텀 분석: 거래량 가속 감지
- 🧠 자동 패턴 감지: 시장 인공지능
- 🎯 다중 시장 세션: 아시아, 런던, 뉴욕, 맞춤형
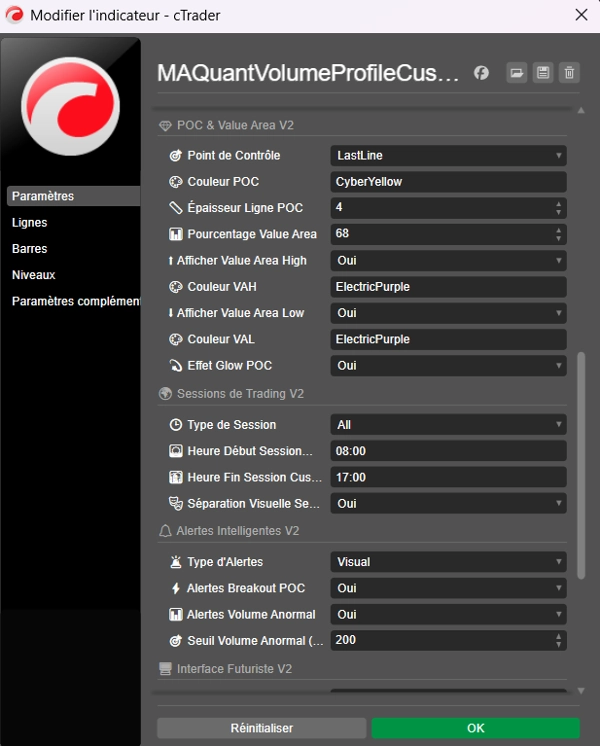
지능형 알림 시스템
- 🚨 시각 및 음성 알림: POC 돌파 및 비정상 거래량
- ⚡ 사용자 정의 임계값: 트리거 레벨 구성
- 📊 실시간 모니터링: 지속적인 시장 상태 감시
- 🔔 즉각 알림: 기회에 대한 즉각 반응
💎 향상된 핵심 기능
고정밀 거래량 프로필
- 🎯 사용자 정의 분석 영역: 직관적인 클릭 선택
- 📏 최대 200 가격 레벨: 최대 세분화
- 🔼🔽 강세/약세 거래량 분리: 정밀 방향 분석
- 📐 조절 가능한 프로필 너비: 최적화된 오른쪽/왼쪽/중앙 배치
전문가용 제어점(POC)
- 🎯 POC 개발 및 최종선: 실시간 추적 또는 고정
- 💫 네온 글로우 효과: 고급 시각적 강조
- 📏 사용자 정의 두께: 최적 가시성을 위한 1-10 픽셀
- ⚡ 돌파 알림: 레벨 돌파 시 알림
기관 가치 영역
- 📊 조절 가능한 백분율: 특정 전략을 위한 0-100%
- ⬆️ 가치 영역 최고점(VAH): 동적 저항
- ⬇️ 가치 영역 최저점(VAL): 동적 지지
- 🎨 테마 색상: 완벽한 시각적 조화
🎨 혁신적인 시각 스타일
🌟 미래 지향적 - 기본값
네온 색상과 고급 조명 효과가 적용된 사이버펑크 인터페이스
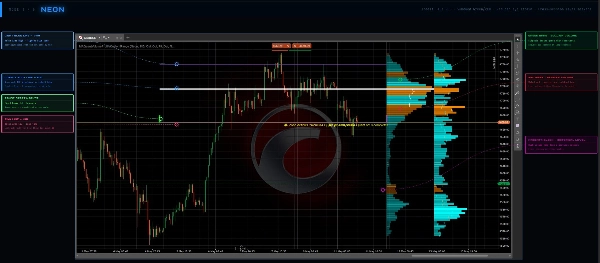
💫 네온
야간 거래를 위한 최대 강도의 초밝은 스타일
💼 프로페셔널
정교한 그라데이션과 기업 색상을 사용한 기관 디자인
🌈 그라데이션
매트릭스 팔레트와 깊이 효과를 통한 부드러운 전환
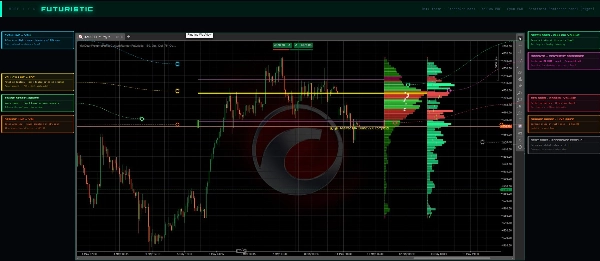
⚪ 클래식
보수적인 환경을 위한 깔끔하고 절제된 스타일
🛠️ 고급 제어
지능형 인터페이스
- 📊 애니메이션 진행 표시기: 4가지 스타일 (선형, 원형, 네온, 매트릭스)
- 📈 실시간 통계: 즉각적인 성능 지표
- 💻 제어판: 모든 매개변수의 중앙 허브
- 🔍 고급 디버그: 3가지 진단 수준 (기본, 일반, 상세)
세션 관리
- 🌍 다중 세션: 아시아 (00:00-09:00), 런던 (07:00-16:00), 뉴욕 (13:00-22:00)
- 🕒 맞춤 세션: 특정 시간 정의
- 🎭 시각적 구분선: 명확한 기간 구분
⚡ 성능 및 최적화
고성능 계산
- 🚀 최적화된 알고리즘: 초고속 데이터 처리
- 📊 향상된 거래량 분포: 정밀 계산 방식
- 🔄 실시간 업데이트: 조정 중 동적 재계산
- 💾 데이터 내보내기: 백테스트용 분석 저장
반응형 인터페이스
- 🖱️ 고급 드래그 앤 드롭: 직관적인 시간대 조정
- ⚡ 부드러운 애니메이션: 프리미엄 경험을 위한 60 FPS
- 🎮 터치 컨트롤: 모든 기기에 최적화된 인터페이스
🎯 전문가용 응용
시장 구조 분석
- 🏗️ 동적 지지/저항: 실제 거래량 기반 레벨
- 📊 고확률 구역: 반전 구역 식별
- 🎯 최적 진입점: 기관 활동 기반 정밀 타이밍
기관 거래
- 💰 대량 거래 발자국: 기관 활동 추적
- ⚖️ 공급/수요 불균형: 움직임 예측을 위한 델타 분석
- 📈 시장 구조 모멘텀: 거래량 기반 돌파 예측
위험 관리
- 🛡️ 지능형 손절 구역: 거래량 프로필 기반 배치
- 🎯 목표 설정: 가치 영역 기반 예측
- 📊 최적화된 포지션 크기: 사용 가능한 유동성에 따른 조정
🏆 경쟁 우위
✅ 차세대 인터페이스 - 시장에서 독특한 미래 지향적 디자인
✅ 기관 성능 - 트레이딩 데스크 수준의 정밀 계산
✅ 완전한 유연성 - 5가지 시각 스타일 + 완전한 맞춤 설정
✅ 지능형 알림 - 능동적인 기회 탐지 시스템
✅ 다중 세션 지원 - 24/7 글로벌 분석
✅ 실시간 업데이트 - 시장 상황에 즉각 적응
🔧 간단한 구성
플러그 앤 플레이 설치
- 📥 구매 후 즉시 다운로드
- 📁 1클릭 설치 플랫폼 내에서
- 🎨 최적화된 프리셋으로 안내되는 구성
- 🚀 모든 고급 도구와 함께 즉시 거래 시작
포함 사항:
✅ MA Quant Volume Profile V2.0 미래 지향 에디션
✅ 5가지 완전한 시각 스타일
✅ 고급 알림 시스템
✅ 유동성 히트맵
✅ 델타 및 모멘텀 분석
✅ 다중 세션 지원
✅ 프리미엄 문서
✅ 평생 업데이트
✅ 우선 기술 지원
🔥 왜 MA QUANT V2.0을 선택해야 하나요?
🎯 정밀 거래
당사의 독자적인 알고리즘은 기관급 정확도로 거래량 분포를 분석하여 오늘날 경쟁이 치열한 시장에서 필요한 우위를 제공합니다.
🚀 미래 대비 설계
차세대 트레이더를 위해 설계된 유일한 거래량 프로필 지표입니다. 사이버펑크 미학과 전문 기능이 만납니다.
📈 입증된 결과
전 세계 전문 트레이더들이 사용하며, MA Quant V2.0은 수백만 달러의 합산 수익을 낸 성공적인 거래를 식별하는 데 도움을 주었습니다.
🛠️ 지속적인 혁신
정기적인 업데이트를 통해 항상 최신 시장 분석 기술과 시각적 향상 기능에 접근할 수 있습니다.
요약
고객 리뷰
5 | 50 % | |
4 | 50 % | |
3 | 0 % | |
2 | 0 % | |
1 | 0 % |


