
Opis
Przegląd
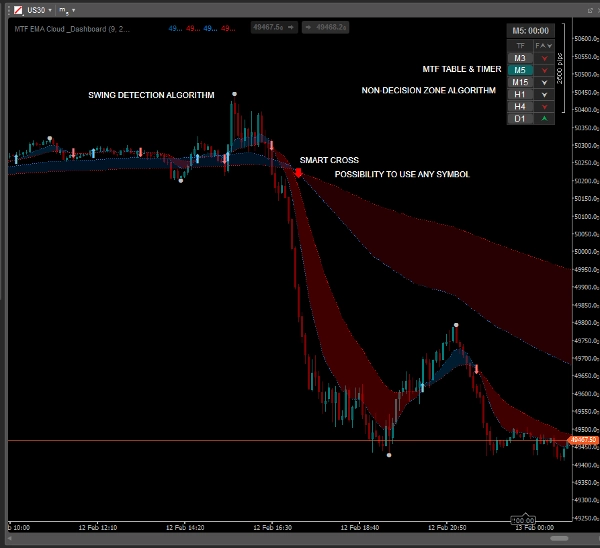
Przestań zgadywać kierunek rynku. EMA MTF Cloud & Dashboard to kompleksowy zestaw narzędzi do podążania za trendem, zaprojektowany dla skalperów i day traderów. Łączy płynność wykładniczych średnich kroczących z mocą analizy wieloczasowej, wszystko w jednym przejrzystym interfejsie wykresu.
W przeciwieństwie do standardowych wskaźników, to narzędzie zawiera logikę Inteligentnej Strefy Neutralnej, która filtruje rynki o zmiennej tendencji, chroniąc Cię przed fałszywymi sygnałami podczas okresów konsolidacji.
Kluczowe funkcje
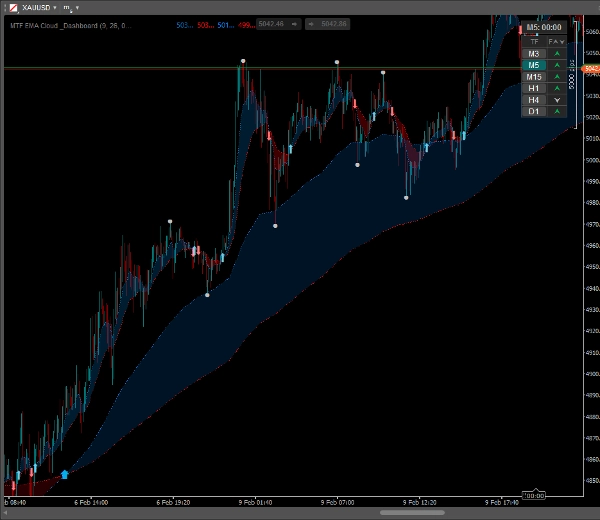
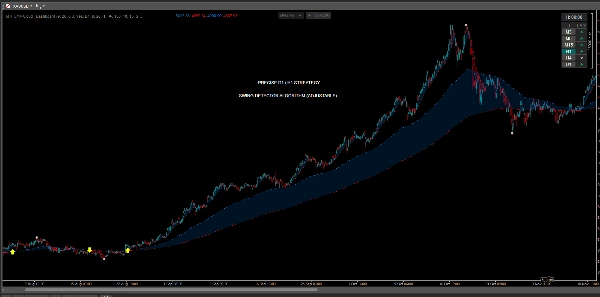
✅ Dynamiczne chmury EMA
Natychmiastowa wizualizacja trendu. Przestrzeń między szybkimi i wolnymi EMA jest wypełniona półprzezroczystą chmurą, co ułatwia identyfikację siły trendu oraz potencjalnych stref wsparcia/oporu.
✅ Nakładka MTF (wieloczasowa)
Zobacz "Duży obraz" bez przełączania wykresów. Wyświetl wyższe ramy czasowe EMA (np. H1) bezpośrednio na wykresie niższego interwału (np. M5).
- Zawiera oddzielne strzałki przecięcia dla trendu MTF!
✅ Inteligentny pulpit trendu
Kompaktowa, klikalna tabela pokazująca status trendu dla 6 ram czasowych (od M3 do dziennej).
- Logika strefy neutralnej: Pulpit wykrywa rynki płaskie (konsolidację) i oznacza je na szaro/srebrno, pomagając unikać złych transakcji.
- Interaktywny: Kliknij dowolny przycisk ramy czasowej w tabeli, aby natychmiast przełączyć wykres.
✅ Punkty Swing High / Swing Low
Automatycznie oznacza znaczące lokalne szczyty i dołki. Idealne do ustawiania Stop Loss lub identyfikowania poziomów Take Profit na podstawie ostatniej struktury cenowej.
✅ Wizualne sygnały przecięcia
Wyraźne, konfigurowalne strzałki pojawiają się dokładnie wtedy, gdy EMA Fast przecina EMA Slow.
- Dostosuj kolory, rozmiary i style strzałek.
✅ Timer świecy
Wbudowany timer odliczający pokazuje dokładnie, ile czasu pozostało do zamknięcia świecy, co jest niezbędne do precyzyjnego timingowania wejść.
Jak handlować (przykład strategii)
- Sprawdź pulpit: Upewnij się, że wyższe ramy czasowe (np. H1, H4) są zgodne (zielone/czerwone). Unikaj handlu, jeśli pokazują "Neutralny" (szary).
- Czekaj na sygnał: Szukaj strzałki przecięcia w kierunku głównego trendu.
- Potwierdź akcją cenową: Użyj punktów "Swing High/Low" do potwierdzenia struktury rynku.
- Wejdź i zarządzaj: Wejdź przy zamknięciu świecy. Użyj chmury EMA jako dynamicznego wsparcia do przesuwania stop lossa.
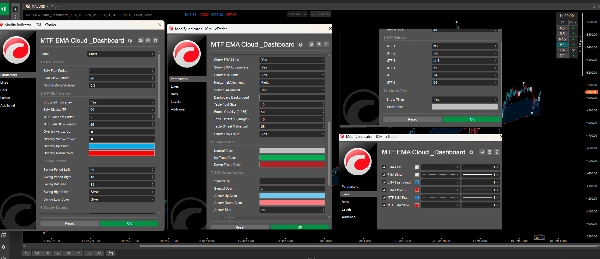
Dostosowanie
Wskaźnik jest wysoce konfigurowalny, aby dopasować się do Twojego stylu:
- Dostosuj okresy EMA dla trybów bieżącego i MTF.
- Zmień kolory chmur, strzałek, punktów Swing i pulpitu.
- Skonfiguruj pozycję i przezroczystość pulpitu.
- Włączaj lub wyłączaj dowolne funkcje niezależnie.
Podsumowanie
A smart dashboard displays trend status across six timeframes (from 3 minutes to daily), incorporating a neutral zone logic that highlights flat or consolidating markets to help avoid false signals. The dashboard is interactive, enabling quick chart switching by clicking on timeframe buttons. The tool automatically marks swing high and low points to assist in setting stop loss and take profit levels based on recent price structure. Visual crossover arrows signal EMA fast and slow line crossovers, with customizable colors and styles. Additionally, a candle timer shows the remaining time until the current candle closes, aiding precise trade timing.
The indicator is highly customizable, allowing adjustments to EMA periods, colors, dashboard position, transparency, and feature toggling to fit individual trading styles. It supports markets including Forex, Crypto, and commodities like gold (XAUUSD), and is tagged for use with symbols such as BTCUSD and USDJPY.
Opinie klientów
5 | 0 % | |
4 | 100 % | |
3 | 0 % | |
2 | 0 % | |
1 | 0 % |


