
説明
⚠️アップデートで本格的な深い情報をお楽しみください⚠️
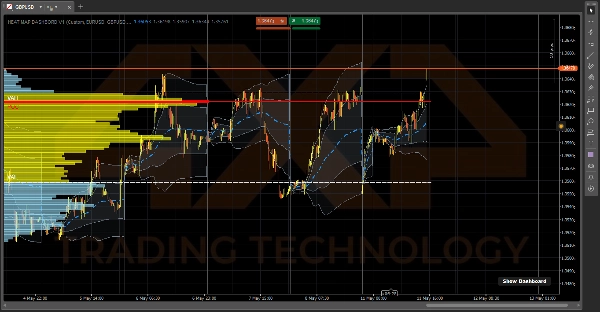
🔥 ヒートマップダッシュボード 📈
cTrader向けの機関投資家グレードのオーダーフロー&モメンタムターミナル。
この ヒートマップダッシュボード は単なる基本的なチャートオーバーレイではなく、プラットフォームに直接組み込まれた三部構成のトレーディングエコシステムです。市場の流動性、真の出来高加重平均、マクロレベルのトレンドを「X線」視覚で提供し、コンピュータの動作を遅くすることなく利用できます。⚡
🎯 その機能(トレーダーの視点)
システムはあなたのトレードを3つの簡単なステップに分解します:
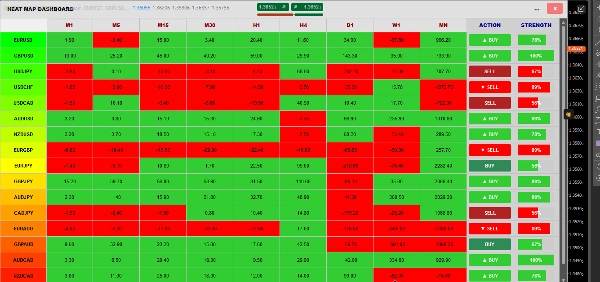
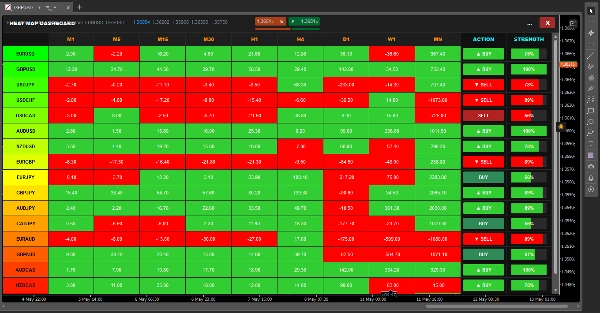
- 🎛️ ステップ1:何を取引するか(マトリックス)。 ダッシュボードは、17の異なる資産を9つの時間枠(M1から月次)でスキャンします。すべてのセルのモメンタムを計算し、色分けします。一目でどのペアが大きなトレンドにあり、取引準備ができているかがわかります。
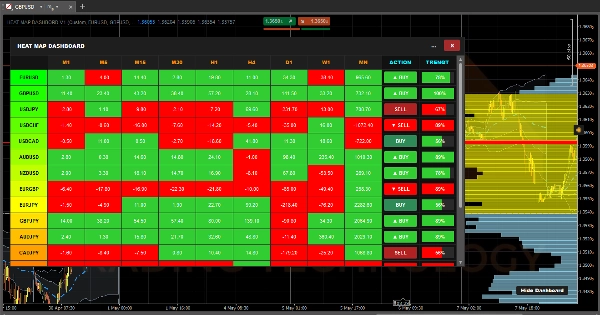
- 🌊 ステップ2:誰がコントロールしているか(VWAP)。 ペアを選んだら、日次アンカードVWAPを見てください。これは単なるローソク足ではなく、出来高に基づく真の平均価格を示します。陰影のついた標準偏差クラウドは動的なサポート/レジスタンスとして機能し、市場が過熱または過小評価されている正確なタイミングを示します。
- 📊 ステップ3:どこでエントリーするか(VRVP)。 最後に、可視範囲出来高プロファイルが重い機関流動性の正確な位置をマッピングします。自動的にコントロールポイント(POC)と70%のバリューエリア(VAH & VAL)ラインを描画し、エントリーとエグジットのための正確なレベルを提供します。
⚙️ 仕組み(内部構造)
これほど多くの計算を行う指標の多くは、プラットフォームを即座にフリーズさせ、cTraderを100%のCPU使用率でクラッシュさせます。それを防ぐために、ヒートマップダッシュボードは3つの高度に最適化された独立したエンジンが同時に動作しています:
1. ダッシュボードエンジン(2秒の心拍)⏱️ もし153の組み合わせ(17ペア×9時間枠)をすべての価格ティックで計算したら、コンピュータは溶けてしまいます。代わりに、このエンジンは厳密な2秒の心拍タイマーで動作します。2秒ごとに14本前のローソク足の価格を静かに見て、現在の価格と比較し、セルを緑(正のモメンタム)または赤(負のモメンタム)で塗ります。
2. VRVPエンジン(スクリーンリーダー)🖥️ 数千本の過去データを読み込む代わりに、出来高プロファイルは動的な「ビューポートリスナー」として機能します。チャートを物理的にズームまたはスクロールしたときのみ作動し、cTraderに現在画面に表示されているローソク足を問い合わせ、その特定のバーの正確な出来高重複を計算し、70%のバリューエリアを即座に再描画します。
3. VWAPエンジン(ティックアキュムレーター)🧮 VWAPはライブティックで唯一計算されるものです。ただし、超高速を維持するために軽量の「累積データシリーズ」を使用しています。毎秒1日の全計算をやり直す代わりに、新しいティックの出来高をバックグラウンドの合計に加算し、時計が真夜中を打つ正確なミリ秒で自動的にリセットします。
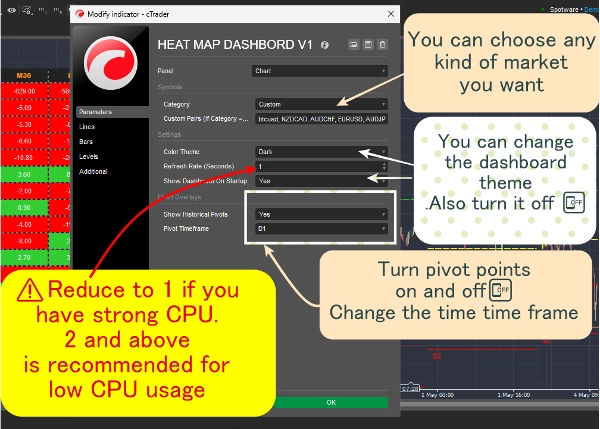
4. ウィンドウマネージャー(シェイプシフター)🪟 ダッシュボードはカスタムC#のサイズ調整ロジックで包まれており、モニターを積極的に監視します。最大化 [ ]または 復元 [=]ボタンを押すと、インジケーターはリアルタイムでChart.WidthとChart.Heightを読み取り、画面に完璧にフィットするように瞬時に形を変え、崩れません!
概要
1. Market Momentum Matrix: Scans 17 assets across 9 timeframes (from 1 minute to monthly), calculating and color-coding momentum to identify trending pairs quickly.
2. Daily Anchored Volume Weighted Average Price (VWAP): Displays true average prices weighted by volume, with dynamic standard deviation clouds indicating overbought or oversold conditions.
3. Visible Range Volume Profile (VRVP): Maps institutional liquidity by highlighting the Point of Control (POC) and 70% Value Area (VAH & VAL) within the visible chart range, aiding precise entry and exit levels.
The dashboard operates via four optimized engines: a 2-second heartbeat engine for momentum updates, a viewport-driven VRVP engine for volume profile recalculations, a tick-accumulating VWAP engine for real-time volume-weighted pricing, and a dynamic window manager that adjusts the interface to fit the chart size. This architecture ensures efficient performance and real-time responsiveness. The indicator supports visualization, signals (including trend strength, breakouts, and reversals), and filtering based on tick data, volume, and market structure analysis. It is tagged for aggressive trading, market structure, liquidity sweeps, support/resistance, and risk dashboard functionalities.
カスタマーレビュー
5 | 100 % | |
4 | 0 % | |
3 | 0 % | |
2 | 0 % | |
1 | 0 % |


