
설명
Hull 이동 평균 컬러드 – 한눈에 보는 추세 방향
개요
Hull 이동 평균 컬러드는 Hull 이동 평균의 반응성을 색상으로 구분된 방향 신호와 결합한 간결한 추세 추종 지표입니다. 상승 추세는 녹색으로, 하락 추세는 빨간색으로 표시하여 복잡한 분석 없이도 모멘텀 방향을 즉시 시각적으로 확인할 수 있습니다.
기능
Hull 이동 평균 기반: 이 지표는 지연을 줄이면서도 부드러움을 유지하도록 설계된 빠르게 반응하는 이동 평균인 Hull 이동 평균(HMA)을 사용합니다. 전통적인 이동 평균과 달리 HMA는 최근 가격 움직임을 우선시하여 추세 변화를 조기에 포착하는 데 특히 유용합니다.
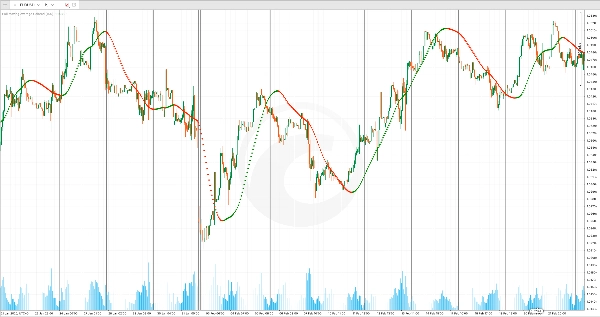
색상 구분 추세 시각화: 단일 선 대신 지표는 방향성 포인트를 표시합니다:
- 녹색 포인트: HMA가 상승할 때 나타나 상승 모멘텀을 나타냅니다
- 빨간색 포인트: HMA가 하락할 때 나타나 하락 모멘텀을 나타냅니다
이 이진 색상 시스템은 추세 방향을 한눈에 명확하게 하여 기울기를 해석하거나 이전 바와 비교할 필요가 없습니다.
주요 특징
오버레이 표시: 지표는 가격 차트 위에 직접 표시되어 실제 가격 수준과 관련된 추세 방향을 쉽게 확인할 수 있습니다. 이를 통해 가격이 이동 평균 위나 아래로 돌파할 때를 쉽게 파악하여 진입 및 청산 시점을 신호할 수 있습니다.
반응 지연 감소: Hull 이동 평균은 표준 지수 이동 평균이나 단순 이동 평균보다 빠르게 반응하여 과도한 변동 없이 시기적절한 신호가 필요한 스윙 트레이더 및 당일 거래자에게 특히 효과적입니다.
간단한 사용자 설정: 기간 매개변수를 조정하여 민감도를 제어할 수 있습니다. 짧은 기간(예: 20-32)은 최근 움직임에 더 민감하게 반응하지만 변동성이 큰 시장에서는 거짓 신호가 발생하기 쉽습니다. 긴 기간(예: 64-128)은 더 부드러운 추세와 적은 거짓 돌파를 제공하지만 빠른 반전을 놓칠 수 있습니다.
실용적 사용법
Hull 이동 평균 컬러드를 거래 방향의 빠른 필터로 사용하세요. 녹색 포인트가 나타나고 가격이 평균 위에 있을 때만 롱 거래를 하고, 빨간색 포인트가 나타나고 가격이 평균 아래에 있을 때만 숏 거래를 하세요. 반대로 색상 변경은 잠재적 청산 신호로 간주하여 녹색에서 빨간색으로 바뀔 때 롱 포지션을 재평가할 시기임을 알립니다.
이 지표는 추세 시장에서 잘 작동하며 특히 4시간 및 일간과 같은 상위 시간대에서 유용하여 하위 시간대 설정을 거래하기 전에 더 넓은 방향성 편향과 일치하도록 도와줍니다.
요약
This indicator overlays directly on price charts and uses a binary color system to indicate trend direction: green points appear when the HMA is rising, signaling upward momentum, and red points appear when the HMA is falling, signaling downward momentum. This visual approach allows traders to quickly identify trend direction without interpreting slopes or comparing previous bars.
Users can adjust the period parameter to control sensitivity—shorter periods increase responsiveness but may generate more false signals, while longer periods smooth trends but may delay signals. The indicator is suitable for various markets including Forex, indices, stocks, and cryptocurrencies such as BTCUSD and XAUUSD. It is particularly useful on higher timeframes (4-hour and daily) for aligning with broader market trends and can assist in identifying potential entry and exit points based on trend changes.
고객 리뷰
5 | 0 % | |
4 | 100 % | |
3 | 0 % | |
2 | 0 % | |
1 | 0 % |


