Beschreibung
MFI-MTF: Multi-Timeframe Money Flow Index
Überblick
MFI-MTF ist ein Momentum-Indikator mit mehreren Zeitrahmen, der eine Perspektive aus höheren Zeitrahmen in Ihr aktuelles Chart bringt. Durch die Berechnung des Money Flow Index (MFI) in einem größeren Zeitrahmen und dessen Anzeige in Ihrem Arbeitschart hilft Ihnen dieser Indikator, überkaufte und überverkaufte Zustände aus mehreren Marktansichten zu erkennen, ohne manuell zwischen Zeitrahmen wechseln zu müssen.
Was er bewirkt
Analyse des Money Flow Index: Der Indikator misst Kauf- und Verkaufsdruck, indem er sowohl Preisbewegungen als auch Handelsvolumen analysiert. Er oszilliert zwischen 0 und 100 und identifiziert, wann ein Vermögenswert übermäßigen Kauf- (überkauft) oder Verkaufsdruck (überverkauft) erfahren hat.
Kontext höherer Zeitrahmen: Anstatt den MFI im aktuellen Chart-Zeitrahmen zu berechnen, zieht MFIMTF Daten aus einem von Ihnen angegebenen größeren Zeitrahmen (täglich, wöchentlich, 4-Stunden usw.). Dies gibt Ihnen institutionelle Momentum-Einblicke ohne das Rauschen niedrigerer Zeitrahmen. Wenn der tägliche MFI beispielsweise überkaufte Zustände zeigt, wissen Sie, dass der größere Trend sich erschöpft – wertvoller Kontext für Ein- und Ausstiegsentscheidungen.
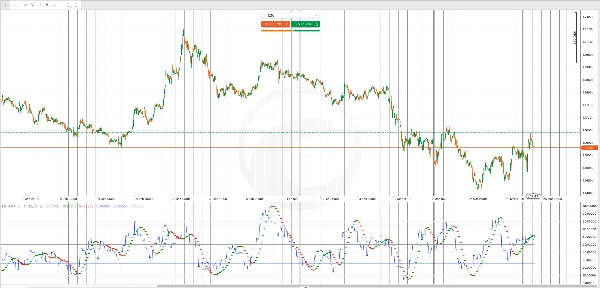
Hull Moving Average Filter: Ein auf den MFI angewendeter Hull Moving Average (HMA) glättet Fehlsignale und hebt Richtungswechsel im Momentum hervor. Grüne Punkte markieren Aufwärtstrends im Momentum, während rote Punkte Abwärtstrends markieren und Ihnen eine schnelle visuelle Bestätigung von Momentum-Richtungsänderungen geben.
Wichtige Ausgaben
MFI-Linie (Blau): Der Hauptwert des Money Flow Index aus Ihrem ausgewählten höheren Zeitrahmen, angezeigt bei jedem Balken Ihres aktuellen Charts.
HMA-Signale (Grüne/Rote Punkte): Grüne Punkte erscheinen, wenn das Momentum nach oben stärker wird; rote Punkte erscheinen, wenn das Momentum schwächer wird oder sich nach unten dreht. Diese dienen als Frühwarnsignale für potenzielle Wendungen.
Referenzniveaus:
- Überkauftes Niveau (Standard 70): Wenn der MFI diesen Wert überschreitet, ist der Kaufdruck übermäßig und Umkehrungen werden wahrscheinlich
- Überverkauftes Niveau (Standard 30): Wenn der MFI darunter fällt, ist der Verkaufsdruck erschöpft und Erholungen werden wahrscheinlich
- Mittellinie (50): Der neutrale Gleichgewichtspunkt zwischen bullischem und bärischem Momentum
Anpassung
Zeitrahmen-Auswahl: Wählen Sie jeden Zeitrahmen, der höher ist als Ihr aktueller Chart (z. B. täglich auf einem 1-Stunden-Chart). Größere Zeitrahmen bieten einen breiteren Trendkontext, aber weniger häufige Signale; kleinere Intervalle bieten mehr Handelsmöglichkeiten, jedoch mit weniger strategischer Perspektive.
MFI-Periode: Passen Sie den Rückblickzeitraum für den Money Flow Index an (Standard 14). Kürzere Perioden machen den Indikator reaktionsschneller auf jüngste Volumenänderungen; längere Perioden glätten die Volatilität und reduzieren Fehlsignale.
HMA-Periode: Steuern Sie die Glättung des Momentum-Filters. Kürzere Perioden machen Trendwechsel offensichtlicher, aber auch lauter; längere Perioden bestätigen Trends zuverlässiger, aber mit langsamerer Signalgebung.
Überkauft-/Überverkauft-Schwellenwerte: Passen Sie diese Niveaus an Ihren Handelsstil an. Konservative Trader könnten 75/25 verwenden; aggressive Trader könnten 80/20 wählen, um auf extremere Bedingungen zu warten.
Praktische Anwendung
Verwenden Sie MFI MTF, um Ihren Ein- und Ausstiegen zusätzliche Übereinstimmung zu verleihen. Ein Verkaufssignal in Ihrem Arbeitszeitrahmen wird zuverlässiger, wenn der tägliche MFI bereits überkauft ist, was darauf hinweist, dass institutionelle Verkäufer wahrscheinlich aktiv sind. Ebenso gewinnen Kaufsignale an Stärke, wenn der MFI des höheren Zeitrahmens überverkauft ist, was zeigt, dass der Verkaufsdruck auf Makroebene erschöpft ist.
Die Farbwechsel des HMA geben Ihnen Echtzeitwarnungen zu Momentumverschiebungen, die Ihnen helfen, verlustreiche Trades frühzeitig zu beenden oder die Positionsgröße zu reduzieren, bevor Umkehrungen schwerwiegend werden.
Zusammenfassung
The indicator includes a Hull Moving Average (HMA) filter applied to the MFI to smooth out noise and highlight momentum shifts. Green dots indicate strengthening upward momentum, while red dots signal weakening or downward momentum. Reference levels include default overbought (70), oversold (30), and a neutral midpoint (50), all customizable to fit different trading styles.
Key outputs are the MFI line from the chosen higher timeframe and HMA signals for momentum direction changes. Adjustable parameters include the MFI lookback period, HMA smoothing period, and overbought/oversold thresholds. MFI-MTF aids in confirming entry and exit points by providing institutional-level momentum insights and real-time alerts to momentum shifts on your working chart.
Kundenbewertungen
5 | 100 % | |
4 | 0 % | |
3 | 0 % | |
2 | 0 % | |
1 | 0 % |