
DynamicVolumeSupplyDemand
Indikator
1.29K downloads
Version 1.0, Apr 2025
Windows, Mac
4.2
Bewertungen: 5
Beschreibung
Vorstellung der Dynamic Supply and Demand Zones von AlgoAlpha, von mir für die Ctrader-Plattform neu erstellt. Dieser Indikator ist darauf ausgelegt, dynamische Angebots- und Nachfragezonen automatisch zu erkennen und auf Ihrem Chart zu visualisieren, um Händlern zu helfen, potenzielle Umkehrbereiche zu identifizieren und die Marktstimmung mit erhöhter Klarheit zu bewerten. Er passt sich den Marktbedingungen mit einem dynamischen Rückblickmechanismus an, wodurch er auf jüngste Kursbewegungen reaktionsfähiger ist. 📈💡
Hauptmerkmale
- 📊 Dynamischer Rückblick: Passt die Rückblickperiode automatisch basierend auf dem jüngsten Pivot-Punkt an, um sicherzustellen, dass die relevantesten Daten analysiert werden.
- 🎯 Pivot-Punkt-Erkennung: Nutzt eine benutzerdefinierte Periode, um bedeutende Pivot-Hochs und -Tiefs zu erkennen und potenzielle Umkehrpunkte präzise zu markieren.
- 🛠 Anpassbare Parameter: Bietet umfangreiche Anpassungsoptionen einschließlich Rückblickperiode, Pivot-Erkennungsempfindlichkeit, Auflösung und Zonentoleranz.
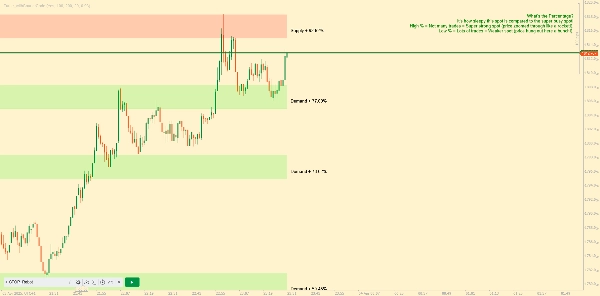
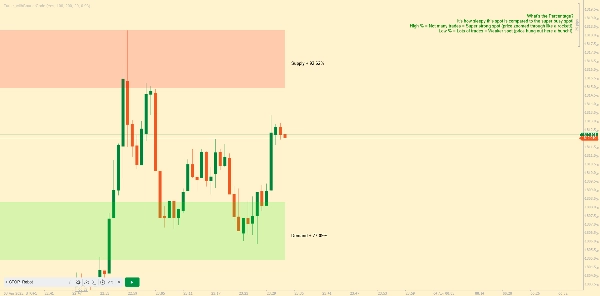
- 🗺 Visuelle Darstellung: Zeigt Angebots- und Nachfragezonen als Kästen im Chart, Hintergrundhervorhebung zur Unterscheidung zwischen bullischen und bärischen Zonen.
- 🖍 Farbkodierte Zonen: Zonen sind farblich kodiert für eine einfache Identifikation: grün für bullisch, rot für bärisch und grau für neutrale Bereiche.
Zusammenfassung
KI-Zusammenfassung
DynamicVolumeSupplyDemand is an indicator for the cTrader platform that automatically identifies and visualizes dynamic supply and demand zones on trading charts. It helps traders locate potential reversal areas and evaluate market sentiment by adapting to recent price movements through a dynamic look-back mechanism. Key features include:
- Dynamic Look-Back: Automatically adjusts the look-back period based on the latest pivot points to analyze the most relevant data.
- Pivot Point Detection: Uses a user-defined period to detect significant pivot highs and lows, marking potential reversal points.
- Customizable Parameters: Allows adjustment of look-back period, pivot detection sensitivity, resolution, and zone tolerance.
- Visual Display: Presents supply and demand zones as boxes on the chart with background highlighting to distinguish bullish and bearish zones.
- Color-Coded Zones: Zones are color-coded for clarity—green for bullish, red for bearish, and gray for neutral levels.
This indicator supports enhanced clarity in market analysis by dynamically adapting to changing market conditions and providing clear visual cues for supply and demand levels.
Indikatorprofil
Kundenbewertungen
4.2
Bewertungen: 5
5 | 40 % | |
4 | 40 % | |
3 | 20 % | |
2 | 0 % | |
1 | 0 % |
Kundenbewertungen
October 12, 2025
Could you please make a new indicator so too remove the explanation and how the indicator works written on the chart? Very nice indicator otherwise!
August 12, 2025
Pros: Identifies dynamic supply and demand zones based on volume. Flexible settings, strong visual clarity. Cons: No alerts or tooltips. Lacks history of previous zones and user template saving.
May 15, 2025
This indicator finds the supply and demand areas very well but it has a problem. But the explanation and how the indicator works written on the chart is very annoying. I hope the designer of this software will solve this problem. Thank you
Diskussion
Häufig gestellte Fragen (FAQ)
Über den cTrader Store verfügbare Produkte, einschließlich Handelsbots, Indikatoren und Plugins, werden von externen Entwicklern bereitgestellt und nur zu Informations- und technischen Zugriffszwecken verfügbar gemacht. cTrader Store ist kein Broker und erbringt keine Anlageberatung, persönlichen Empfehlungen oder eine Garantie für zukünftige Performance.


Preis
Seit 09/01/2025
11.78K
Kostenlose Installationen