
Beschreibung
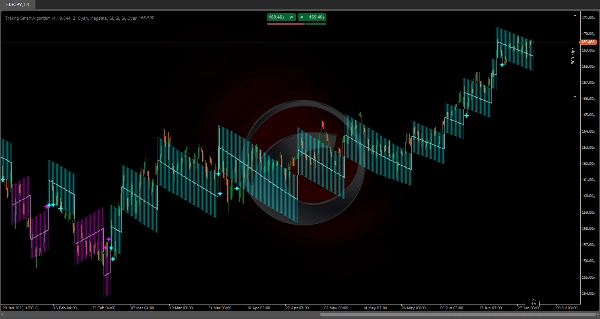
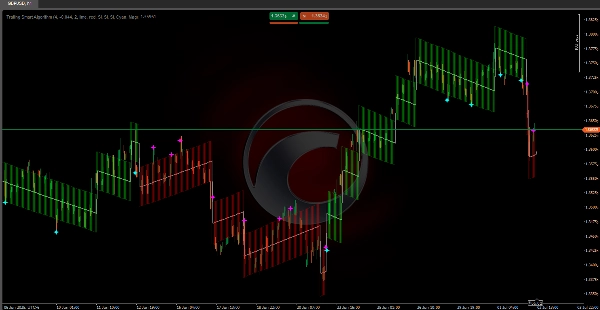
Trailing Smart Algorithmus
https://chartshots.spotware.com/c/69f0f1d89000b
Integriert mathematische Algorithmen 🧠, die speziell entwickelt wurden, um den Preis konsequent in jeder Marktbedingung 🌐 zu verfolgen.
Seine Berechnungsstruktur stellt sicher, dass die Trendlinie immer synchron bleibt mit den Preisbewegungen und vermeidet die typische Verzögerung traditioneller Indikatoren ⏳.
Im Gegensatz zu herkömmlichen Algorithmen verwendet dieses System präzise Volatilitätsmessungen 📊 und wendet automatische Anpassungen ⚙️ an, die eine optimale Verfolgung garantieren. Seine internen Berechnungen sind darauf ausgelegt, eine genaue Darstellung der Marktrichtung zu liefern und Präzision sowohl bei schnellen Bewegungen ⚡ als auch bei allmählicher Trendentwicklung 🕊️ zu bewahren.
https://chartshots.spotware.com/c/69f0f218591b0
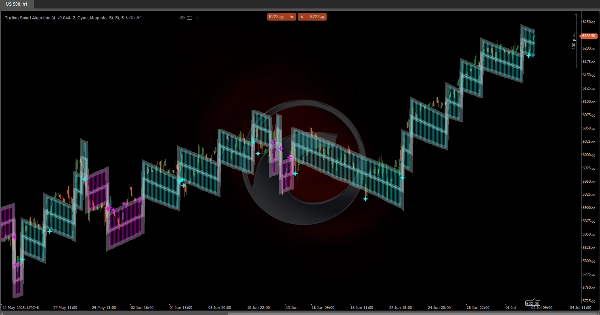
💡 Wie funktioniert es?
Der Indikator arbeitet mit einem adaptiven Schritt-System, das sich in Richtung des dominanten Trends bewegt.
Es basiert auf drei Hauptkomponenten:
https://chartshots.spotware.com/c/69f0f2b19e4d3
1️⃣ Trendwechsel-Erkennung
Das System überwacht kontinuierlich den Preis, um signifikante Bewegungen zu erkennen, die einen bestimmten Schwellenwert überschreiten (Impuls-Auslöser 🎯).
Wenn sich der Preis weit genug von der aktuellen Trendlinie entfernt, erkennt der Indikator eine potenzielle Richtungsänderung und positioniert seine Hauptlinie neu.
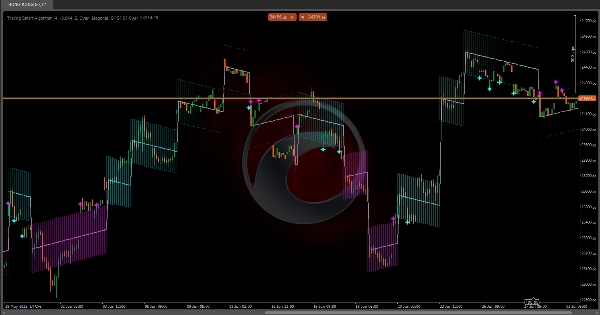
2️⃣ Dynamisches Trailing
Sobald die Richtung festgelegt ist, bewegt sich die Trendlinie Schritt für Schritt 🪜 in dieselbe Richtung wie der Markt.
Jeder Schritt wird basierend auf der aktuellen Volatilität berechnet (ATR 📈):
• In volatileren Märkten sind die Schritte größer 🌊
• In ruhigeren Märkten sind die Schritte kleiner 🌿
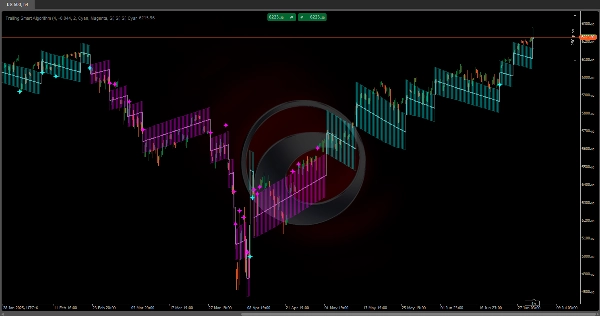
3️⃣ Volatilitätskanal
Ein Kanal bildet sich um die Hauptlinie (obere und untere Bänder), der die normale Volatilitätszone 📉📈 darstellt.
Dieser Kanal hilft zu erkennen, ob sich der Preis innerhalb normaler Parameter bewegt oder extreme Bewegungen 🚨 macht.
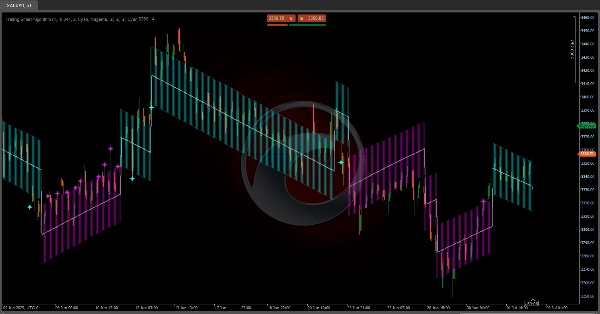
📏 Volatilitätskanal
• Oberes Band: Obergrenze des Volatilitätskanals
• Unteres Band: Untergrenze des Volatilitätskanals
✨ Retest-Signale
• Cyanfarbene Sterne 🌟: Preis berührt oder durchbricht das untere Band während eines Aufwärtstrends
• Magenta Sterne ⭐: Preis berührt oder durchbricht das obere Band während eines Abwärtstrends
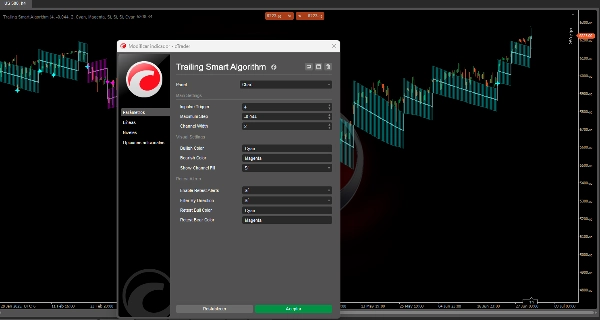
⚙️ Parametereinstellungen
🔹 Hauptparameter
Impuls-Auslöser (Standardwert: 4)
Was bewirkt er?
Bestimmt die Empfindlichkeit zur Erkennung von Trendwechseln. Es ist der ATR-Multiplikator, der definiert, wie stark sich der Preis bewegen muss, um eine Richtungsänderung auszulösen.
Auswirkung bei Änderung:
• Höhere Werte (5–8):
- Widerstandsfähiger gegen Trendwechsel 🛡️
- Weniger Fehlsignale
- Langsamere Reaktion auf echte Veränderungen
• Niedrigere Werte (2–3):
- Höhere Empfindlichkeit 🎯
- Schnellere Reaktion
- Wahrscheinlicher Fehlsignale in Seitwärtsmärkten
Maximale Schrittgröße (Standardwert: -0.044)
Was bewirkt sie?
Begrenzt die maximale Größe jedes Schrittes, den die Trendlinie machen kann. Es ist ein negativer Wert, der als Obergrenze wirkt.
Auswirkung bei Änderung:
• Weniger negativ (-0.020 bis -0.030):
- Größere Schritte 🚀
- Aggressivere Trendverfolgung
• Negativer (-0.050 bis -0.080):
- Kleinere, allmähliche Schritte 🌱
- Konservativere Nachverfolgung
Kanalbreite (Standardwert: 2)
Was bewirkt sie?
Definiert die Breite des Volatilitätskanals um die Hauptlinie.
Auswirkung bei Änderung:
• Höhere Werte (3–4):
- Breiterer Kanal 🟢
- Weniger Retest-Signale
- Größere Toleranz gegenüber Volatilität
• Niedrigere Werte (1–1.5):
- Schmalerer Kanal 🔴
- Mehr Retest-Signale
- Mehr Empfindlichkeit gegenüber Rauschen
🎨 Visuelle Parameter
Bullische Farbe / Bärische Farbe
Definieren die Farben für Aufwärts- und Abwärtstrends jeweils.
Kanalfüllung anzeigen
Aktivieren oder deaktivieren Sie die visuelle Füllung des Volatilitätskanals 🌈.
🔔 Retest-Einstellungen
Retest-Warnungen aktivieren
Schaltet Retest-Signale ein oder aus, wenn der Preis die Kanalbänder berührt.
Nach Richtung filtern
Wenn aktiviert, werden nur Retest-Signale angezeigt, die zum aktuellen Trend passen:
• In einem Aufwärtstrend: Nur Signale am unteren Band
• In einem Abwärtstrend: Nur Signale am oberen Band
🌟 Zusammenfassung der Retest-Signale
• Cyanfarbener Stern am unteren Band: Potenzieller bullischer Abpraller von dynamischer Unterstützung ✅
• Magenta Stern am oberen Band: Potenzieller bärischer Abpraller von dynamischem Widerstand ❌
Zusammenfassung
Kundenbewertungen
5 | 100 % | |
4 | 0 % | |
3 | 0 % | |
2 | 0 % | |
1 | 0 % |


![„[Hamster-Coder] Pivot Points MTF“-Logo](https://cdn.ctrader.com/image/webp/4c143e5a-309c-40e3-a578-f04d1e133ffa_31159)


![„[Hamster-Coder] Moving Average MTF“-Logo](https://cdn.ctrader.com/image/webp/b11b98b1-194d-4b8e-b00e-d611826ad159_31226)


