
Fractals
Indicateur
2 achats
Version 1.0, Aug 2025
Windows, Mac
4.0
Avis : 2
Description
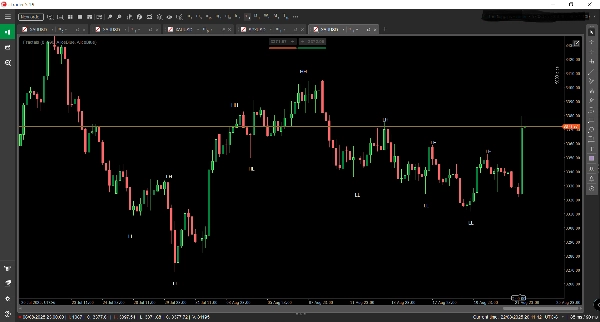
🧠 Fractales – Structure du marché visualisée
Fractales est un indicateur de trading de précision pour cTrader qui révèle l'architecture cachée de l'action des prix. En détectant et en étiquetant automatiquement les plus hauts plus hauts (HH), les plus bas plus hauts (HL), les plus hauts plus bas (LH) et les plus bas plus bas (LL) directement sur le graphique, Fractales transforme les données brutes des prix en une carte claire et exploitable de la structure du marché.
🔍 Caractéristiques clés :
- Cartographie de la structure en temps réel : Identifie instantanément les points de retournement et les étiquette pour exposer la direction de la tendance et les zones de retournement.
- Conscience multi-échelles : Conçu pour mettre en évidence la structure macro sur des périodes plus longues, offrant aux traders un avantage stratégique pour aligner les entrées avec les tendances dominantes.
- Optimisation du suivi de tendance : Idéal pour les traders utilisant des stratégies de momentum, de cassure ou de retracement, aidant à confirmer le biais et à éviter les pièges contre-tendance.
- Superposition visuelle épurée : Annotations élégantes du graphique qui s'intègrent parfaitement à toute configuration de trading, améliorant la clarté sans encombrement.
🧭 Cas d'utilisation :
- Repérer les tendances émergentes et les changements structurels avant qu'ils ne soient évidents.
- Valider les configurations de trading avec une confirmation structurelle.
- Combiner avec des moyennes mobiles, le volume ou des indicateurs personnalisés pour une confluence en couches.
- Parfait pour le backtesting manuel et les évaluations de sociétés de trading où la logique basée sur la structure est essentielle.
Résumé
Résumé IA
Fractals is a trading indicator designed for the cTrader platform that visualizes market structure by automatically detecting and labeling key price action points: Higher Highs (HH), Higher Lows (HL), Lower Highs (LH), and Lower Lows (LL). It provides real-time mapping of swing points to reveal trend direction and potential reversal zones. The indicator supports multi-timeframe analysis, emphasizing macro structure on higher timeframes to help align trades with dominant market trends. Fractals is optimized for momentum, breakout, and pullback strategies, assisting traders in confirming bias and avoiding counter-trend trades. Its clean visual overlay integrates smoothly with existing chart setups, enhancing clarity without clutter. Use cases include spotting emerging trends and structural shifts early, validating trade setups with structural confirmation, combining with other indicators like moving averages or volume for layered analysis, and supporting manual backtesting and prop firm evaluations where market structure is critical. The indicator applies across various markets including Forex, indices, commodities, cryptocurrencies, and stocks.
Profil de l'indicateur
Avis clients
4.0
Avis : 2
5 | 0 % | |
4 | 100 % | |
3 | 0 % | |
2 | 0 % | |
1 | 0 % |
Avis clients
August 31, 2025
it gives the trade idea another check, but the result needs a journal.
August 27, 2025
Discussion
Questions fréquentes
Prop
Forex
Indices
Commodities
Crypto
Stocks
Les produits disponibles sur cTrader Store, notamment les bots de trading, les indicateurs et les plug-ins, sont fournis par des développeurs tiers et mis à disposition à titre informatif et à des fins d'accès technique uniquement. cTrader Store n'est pas un courtier et ne fournit aucun conseil en investissement, aucune recommandation personnelle ni aucune garantie quant aux performances futures.


Prix
26
Ventes
2.18K
Installations gratuites