Description
📈 Indicateur AutoFibRetracement
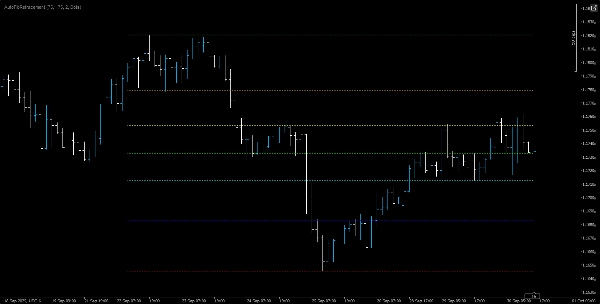
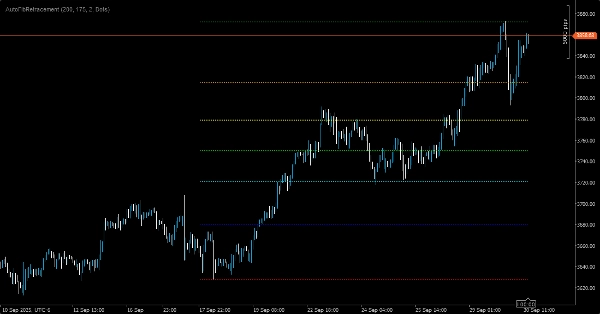
L'indicateur AutoFibRetracement est un outil de superposition puissant conçu pour tracer automatiquement les niveaux de retracement de Fibonacci basés sur les récents mouvements de prix. Idéal pour les traders cherchant à identifier des zones potentielles de support et de résistance, cet indicateur calcule dynamiquement les niveaux de retracement en utilisant des paramètres personnalisables et les affiche directement sur le graphique.
🔧 Fonctionnalités clés :
• Détection automatique des oscillations : calcule les points hauts et bas des oscillations dans une fenêtre de retour définie par l'utilisateur.
• Fenêtre de période personnalisable : Les traders doivent sélectionner une fenêtre appropriée pour capturer avec précision les points hauts et bas significatifs des oscillations. Ce choix est crucial pour aligner les niveaux de retracement avec la structure réelle du marché.
• Niveaux de Fibonacci : inclut les ratios standards — 0 %, 23,6 %, 38,2 %, 50 %, 61,8 %, 78,6 % et 100 % — chacun codé par couleur pour une clarté visuelle.
• Options de style visuel :
• Opacité ajustable (0–255) pour la transparence des lignes.
• Épaisseur et style de ligne configurables (par exemple, pointillé, plein).
• Affichage en superposition : trace directement sur le graphique des prix pour une intégration transparente avec d'autres outils d'analyse technique.
🎯 Cas d'utilisation :
Parfait pour les traders de swing, les suiveurs de tendance et les analystes techniques qui s'appuient sur les zones de retracement de Fibonacci pour planifier les entrées, sorties et niveaux de stop-loss. L'efficacité de cet indicateur dépend de la capacité du trader à choisir la bonne taille de fenêtre — trop courte peut manquer des oscillations plus larges, trop longue peut diluer l'action récente des prix.