
说明
⚡ Kaufman效率比率(KER)
趋势清晰度,量化体现。
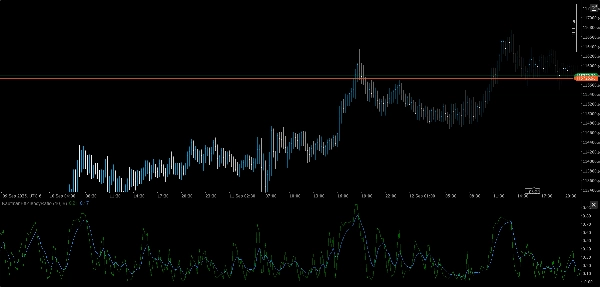
Kaufman效率比率(KER)是一种精确工具,用于衡量价格从点A到点B的移动效率——而不会被噪音干扰。无论您是在验证突破条件还是过滤横盘震荡,KER都能为您提供一个介于0到1之间的清晰分数,反映方向意图与波动性的关系。
🔍 它的作用
- 计算Kaufman效率比率:
- 输出一个归一化值,从 0(纯噪音) 到 1(完美趋势)
- 明确区分趋势与非趋势状态,无任何歧义
- 适用于自适应叠加、状态过滤和信号门控
🛠️ 主要特征
- 模块化输入管理,支持多时间框架数据源
- 跨资产兼容:外汇、加密货币、指数、股票
- 轻量级、实时逻辑,无平滑延迟
- 即插即用,兼容您现有的套件架构
🎯 使用场景
- 趋势验证:在信号执行前确认方向偏好
- 噪音过滤:抑制低效价格行为期间的入场
- 状态检测:与波动感知叠加配合,实现更智能的转换
- 策略构建:作为突破、动量或偏好逻辑的核心指标
💡 额外提示
KER免费、快速且极其高效——就像您的代码一样。无冗余,无过滤。只有纯粹的市场意图,提炼而成。
摘要
AI 摘要
The Kaufman Efficiency Ratio (KER) is an indicator designed to measure the efficiency of price movement between two points by quantifying trend clarity. It calculates a normalized value ranging from 0 (indicating pure noise) to 1 (indicating a perfect trend), thereby distinguishing trending market conditions from sideways or choppy price action. KER is suitable for use across multiple asset classes including forex, cryptocurrencies, indices, and equities.
Key features include a modular input manager supporting multi-timeframe data, lightweight real-time calculation without smoothing lag, and compatibility with existing trading system architectures. The indicator is useful for validating trend direction before executing trades, filtering out noise to avoid inefficient entries, detecting market regimes when combined with volatility-aware overlays, and serving as a core metric in breakout, momentum, or bias-based strategies.
KER provides a clear, unambiguous score reflecting directional intent versus volatility, making it applicable for adaptive overlays, regime filters, and signal gating in trading strategies.
指标配置
客户评价
0.0
评价:0
客户评价
该产品尚无评价。已经试过了?抢先告诉其他人!
讨论
常见问答
Breakout
Scalping
AI
cTrader Store 提供的所有产品,包括交易机器人、指标和插件,均由第三方开发者提供,仅供信息参考和技术访问之用。cTrader Store 并非经纪商,不提供投资建议、个人推荐或任何未来业绩保证。


猜您喜欢


价格
26
销售
2.18K
免费安装