
说明
CVD ai
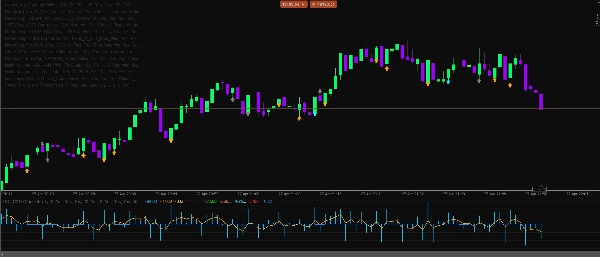
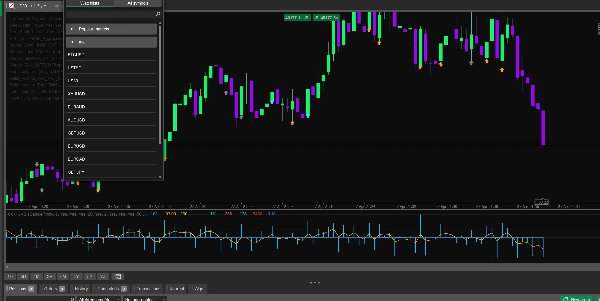
Delta CVD Advanced 是一款专业的动量和订单分析指标,专为希望直接从市场行为中更清晰地了解买卖压力的交易者设计。它将 Delta、CVD、实时tick动量、吸收、背离、交易时段过滤器、波动性保护以及智能汇聚引擎结合成一个简洁的分析工具。
该指标适用于外汇、黄金、指数、加密货币和石油市场的剥头皮、日内交易及短期动量确认。
主要功能
- 使用 uptick/downtick 逻辑的实时 Delta 计算
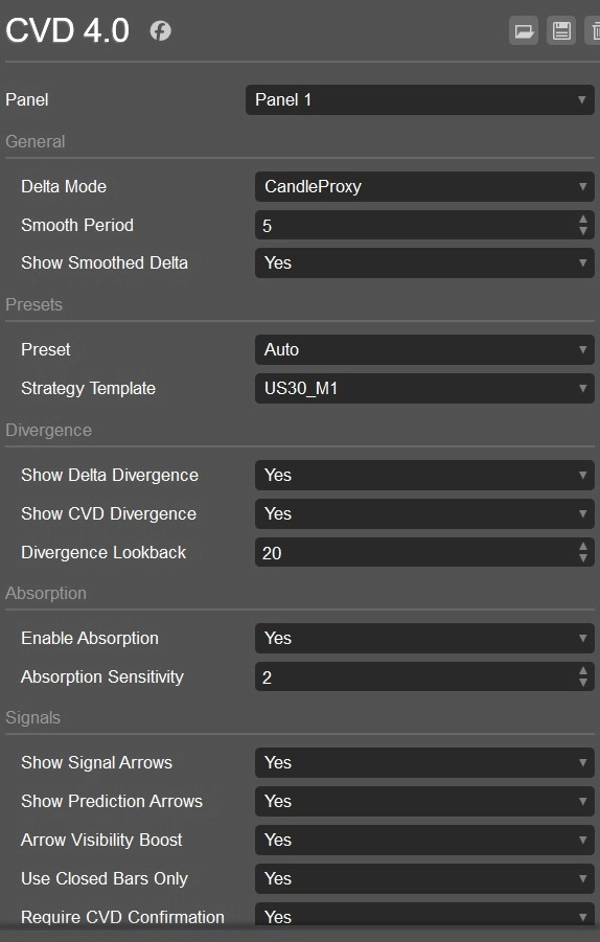
- 用于历史分析的蜡烛代理 Delta 模式
- 累计成交量 Delta 线以追踪压力变化
- 平滑 Delta 线以获得更清晰的动量读数
- 买卖双色 Delta 直方图
- 基于 tick 的动量计算以捕捉实时市场冲击
- 结合 CVD 斜率和 tick 冲击的混合动量模式
- CVD 重置选项:从不、每日或按交易时段
- 看涨和看跌 Delta 背离检测
- 看涨和看跌 CVD 背离检测
- 吸收检测以识别未能推动价格的压力
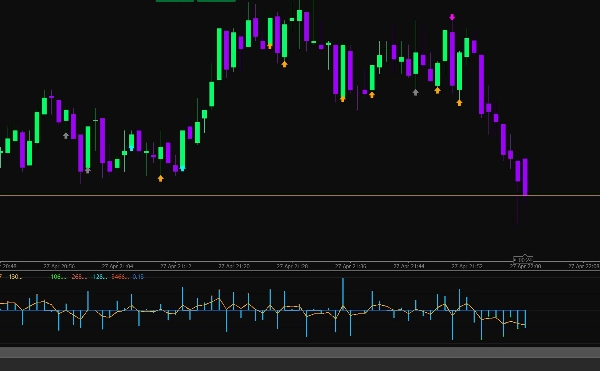
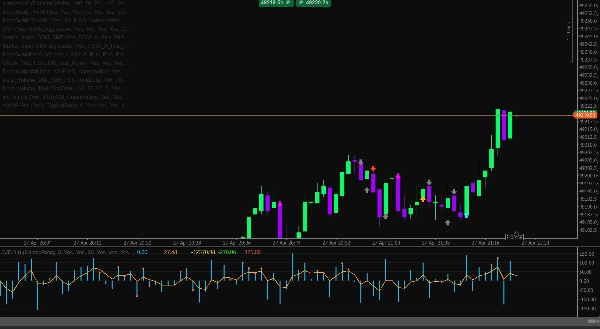
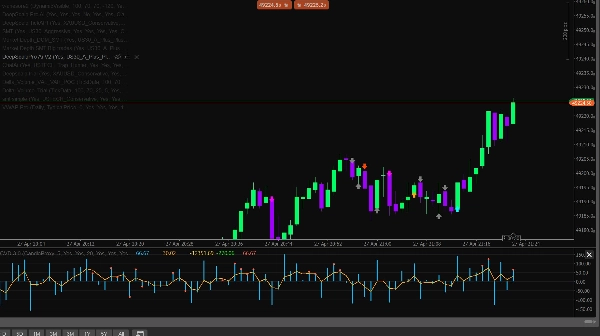
- 买入和卖出机会的信号箭头
- 早期动量转变预警的预测箭头
- 信号的可选 CVD 确认
- 带方向评分的智能汇聚引擎
- DOM 代理压力过滤器
- 流动性扫荡检测过滤器
- 亚洲、伦敦和纽约交易时段过滤器
- 使用 UTC 时间的自动交易时段检测
- 使用 ATR 限制的波动性保护
- 点差保护以避免不良市场条件
- 成交量比率过滤器以避免弱低量信号
- 外汇、黄金、指数、加密货币和石油的符号预设
- US30 M1、USTECH M1、XAUUSD M1、BTCUSD M1 和 Oil M1 的策略模板
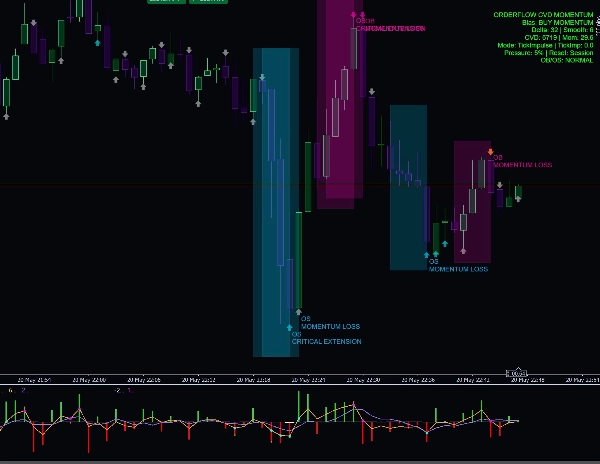
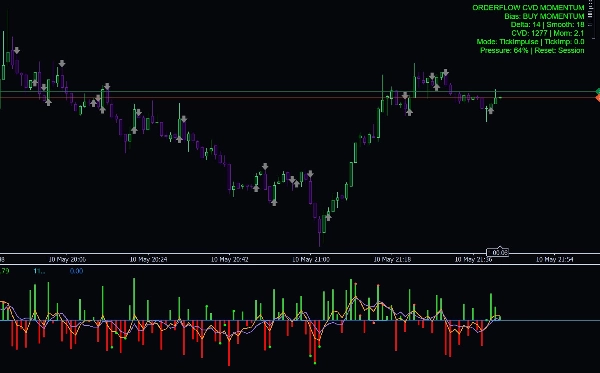
- 显示偏向、Delta、平滑 Delta、CVD、动量、压力百分比和重置模式的信息仪表盘
- 带冷却控制的可选日志警报
交易者为何使用它
Delta CVD Advanced 帮助交易者了解当前谁在掌控市场:买方还是卖方。该指标不仅依赖价格蜡烛,还分析推动价格变动背后的压力。这使其在确认入场、避免弱信号、识别反转、发现吸收以及在价格明显变化前检测动量转变方面非常有用。
tick 动量模式特别适合实时剥头皮,因为它对实时价格冲击作出反应,而 CVD 和平滑 Delta 工具则帮助确认价格变动背后是否有真实的力量支持。
最佳使用场景
- 剥头皮交易
- 日内交易
- 动量确认
- 反转确认
- 流动性扫荡分析
- Delta 和 CVD 背离交易
- 黄金、指数、加密货币、石油和外汇货币对
- M1、M5 及其他较低时间框架
重要提示
该指标是一个分析决策支持工具。它不保证盈利,应与适当的风险管理、市场结构和经过测试的交易计划一起使用。
摘要
AI 摘要
CVD Ai is an advanced Volume Spread Analysis (VSA) and Cumulative Volume Delta (CVD) indicator designed to analyze buying and selling pressure in financial markets. It integrates multiple analytical tools including live Delta calculation based on uptick/downtick logic, candle proxy delta for historical data, smoothed Delta lines, and a cumulative volume delta line to track market pressure over time. The indicator features buy/sell colored Delta histograms, tick-based momentum calculations, and a hybrid momentum mode combining CVD slope with tick impulse.
Additional functionalities include detection of bullish and bearish Delta and CVD divergences, absorption detection to identify pressure that fails to move price, and signal arrows for buy/sell opportunities alongside prediction arrows for early momentum shifts. It incorporates session filters for Asia, London, and New York trading sessions, volatility and spread guards, volume ratio filters, and a smart confluence engine with directional scoring.
CVD Ai supports markets such as Forex, Gold, Indices, Crypto, and Oil, and is optimized for scalping, intraday trading, and short-term momentum confirmation on lower timeframes like M1 and M5. It offers strategy templates for specific symbols including US30, USTECH, XAUUSD, BTCUSD, and Oil. The indicator includes an info dashboard displaying bias, Delta, smoothed Delta, CVD, momentum, pressure percentage, and reset mode options.
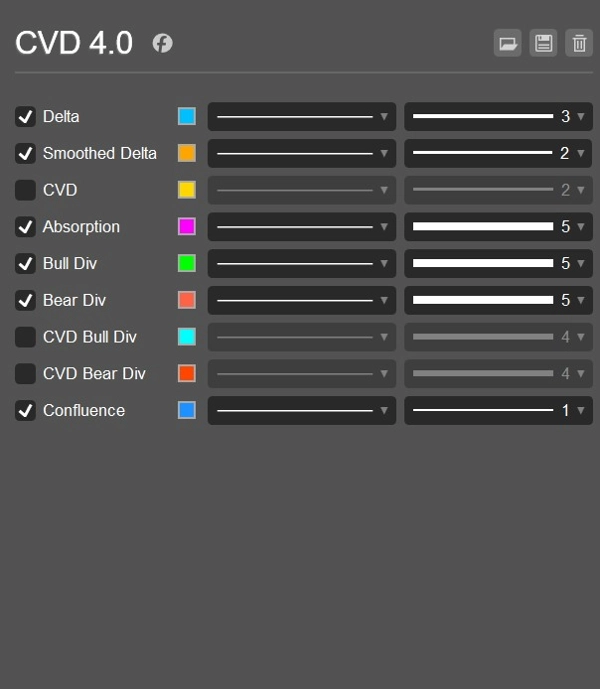
指标配置
客户评价
4.0
评价:2
5 | 0 % | |
4 | 100 % | |
3 | 0 % | |
2 | 0 % | |
1 | 0 % |
客户评价
February 12, 2026
the first 10 trades should stay boring, and The log becomes easier to read.
February 11, 2026
M15 is enough for the first pass. The rules are easier to keep in view.
讨论
常见问答
Signal
Indices
Supertrend
NZDUSD
AI
NAS100
ATR
cTrader Store 提供的所有产品,包括交易机器人、指标和插件,均由第三方开发者提供,仅供信息参考和技术访问之用。cTrader Store 并非经纪商,不提供投资建议、个人推荐或任何未来业绩保证。
该作者的其他作品


价格
6
销售
691
免费安装