

说明
理念
一种移动平均线,适应趋势的发展,而不是将趋势强制固定在一个固定周期内。
问题
大多数移动平均线需要一个固定的回溯周期。
但趋势的发展并非固定时长。
短周期反应快,但容易被短期波动干扰。
长周期能平滑更多噪音,但当价格强烈波动时可能严重滞后。
问题不在于选择“正确”的周期。
问题在于周期本身是固定的,而趋势却在不断发展。
核心概念:趋势决定周期,移动平均线适应趋势。
传统移动平均线以周期为主要参考。
超级趋势移动平均线以趋势结构为主要参考。
它不是问:
“我应该使用哪个固定的移动平均周期?”
而是问:
“当前趋势到目前为止是如何发展的?”
趋势决定自适应移动平均线的起点及其有效长度随时间的发展。
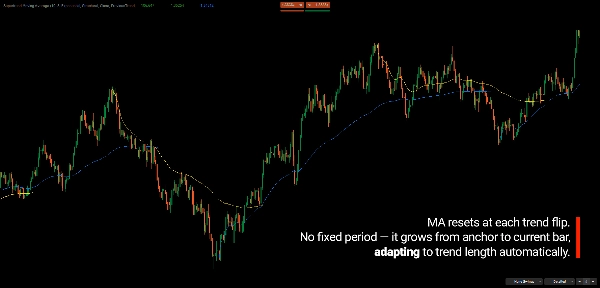
当新趋势开始时,移动平均线锚定于前一趋势的结构极值,并从该点向前发展。随着新趋势的持续,有效周期随着从锚点开始发展的柱数增长。
趋势设定结构,移动平均线随之适应。
功能
该指标根据当前趋势的发展动态调整其有效移动平均线长度。
新识别的趋势以较短的有效长度开始,使移动平均线反应更快。
随着趋势的延续,有效长度变长,使移动平均线逐渐变得更平滑。
移动平均线并非简单地从固定数量的最近柱计算,而是从前一趋势建立的结构锚点开始计算并发展。
当趋势变化时,结构参考重置,新的自适应测量开始。
这创造了一条根据趋势已发生情况改变行为的移动平均线。
它不试图预测下一趋势将持续多久。
它适应已经发展的持续时间和结构。
工作原理
- 超级趋势识别当前趋势及其结构转变。
- 指标识别前一趋势的极端收盘价。
- 该结构极值成为自适应移动平均线的锚点。
- 随着新趋势的发展,从锚点开始的柱数决定移动平均线的有效长度。
- 移动平均线使用该不断发展的长度重新计算。
- 当趋势变化时,结构参考重置,过程重新开始。
自适应长度可以与不同的移动平均计算方法结合使用。
趋势的两种视角
该指标提供两个超级趋势参考:
结构性超级趋势
一个更广泛的趋势参考,旨在捕捉更大的结构变化,同时对短期价格波动不那么敏感。
原始超级趋势
一个更具反应性的参考,更快响应价格变动,并能揭示更广泛趋势内的短期动量变化。
这两种视角并非自动信号。
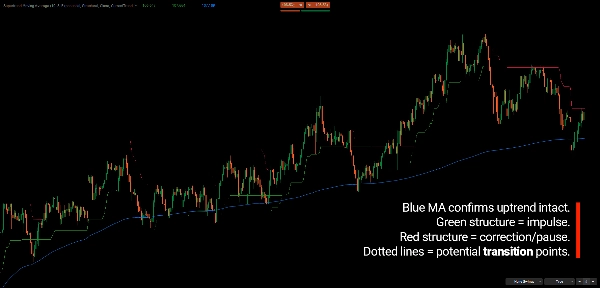
它们的关系提供了趋势发展额外的背景信息。
当两个参考一起移动时,提供了更清晰的方向一致性视图。
当它们分歧时,差异可以为修正、过渡或更广泛趋势内的短期运动提供背景。
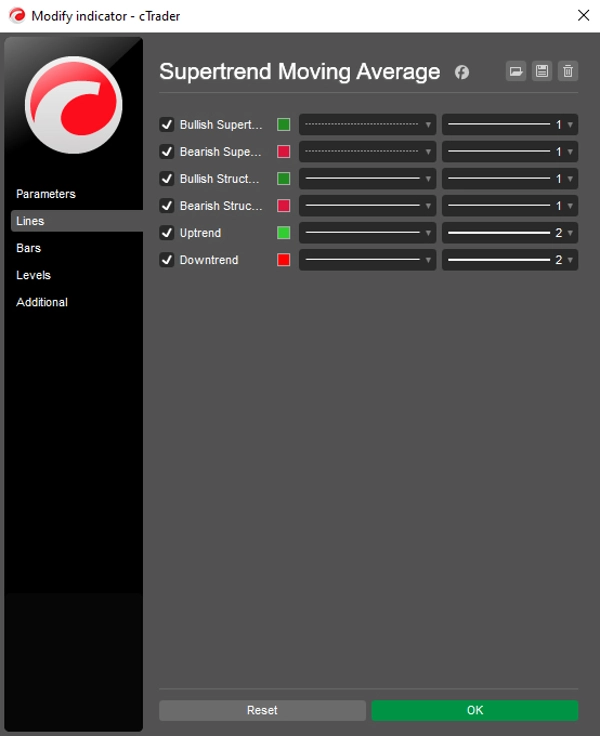
原始超级趋势(点状)仅在与结构性超级趋势不同的柱上绘制,因此分歧明显。每个视角可以独立显示或隐藏。
多时间框架背景
控制移动平均线的趋势不必来自当前图表的时间框架。
例如,日线趋势可以控制显示在H1图表上的自适应移动平均线。
这允许高时间框架趋势定义测量行为,而低时间框架提供价格发展的更详细视图。
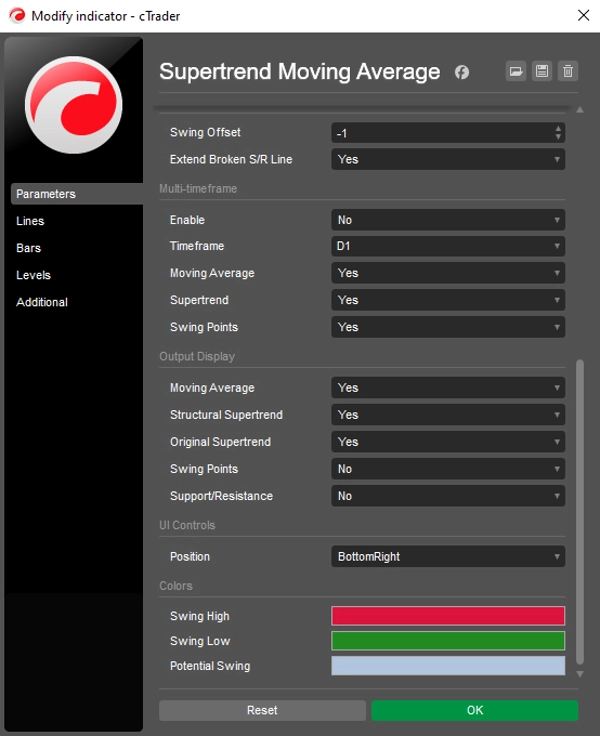
多时间框架(MTF)涵盖三个输出,每个都可独立切换:
- 移动平均线 – 自适应移动平均线由高时间框架趋势驱动。
- 超级趋势 – 结构性和原始超级趋势在高时间框架柱上计算并映射到图表。它们在高时间框架柱形成期间每个刻度更新。
- 摆动点 – 摆动和自动支撑/阻力在高时间框架柱上计算。标记位于高时间框架柱内的实际价格极值,扫掠、翻转和失效在高时间框架柱收盘时评估。支撑/阻力标签和线端点仍在每个图表柱上更新。
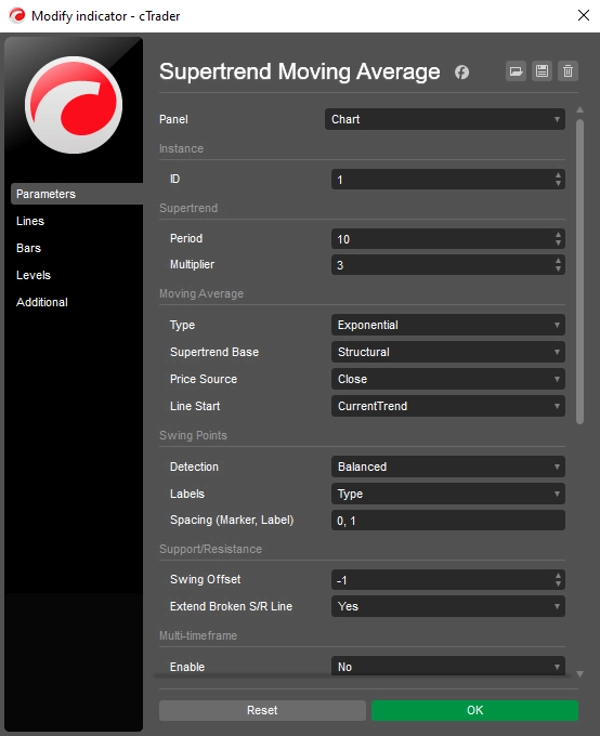
多时间框架参数组包含启用、时间框架,以及移动平均线、超级趋势和摆动点的各一个开关。默认关闭MTF;启用后,所有三个输出使用所选时间框架,除非单独关闭。
MTF时间框架可以高于、等于或低于图表时间框架。当低于或等于图表时间框架时,每个图表柱使用其内最后一个高时间框架柱(图表柱收盘时的值),摆动标记位于包含高时间框架柱开盘的图表柱上。
注意:高时间框架移动平均线在高时间框架柱首次出现时评估,因此在该柱形成期间不变。
自动历史加载
高时间框架移动平均线需要足够的图表历史以重建高时间框架趋势。当图表柱数不足时,指标会自动请求更多历史,并重复直到满足要求。
图表上的警告(“加载更多N根柱”)仅作为最后手段出现:当无更多历史可用、最后请求无新增数据、请求超时或需求非常大时。
可选摆动背景
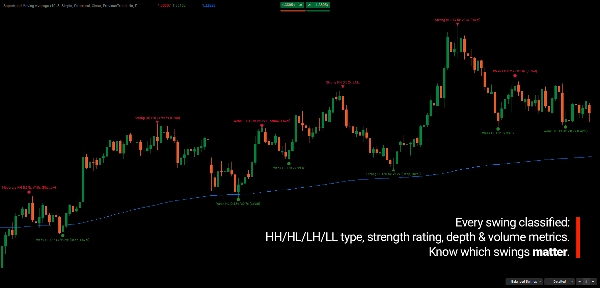
指标还可以显示摆动信息,如:
- HH / HL / LH / LL
- 摆动强度
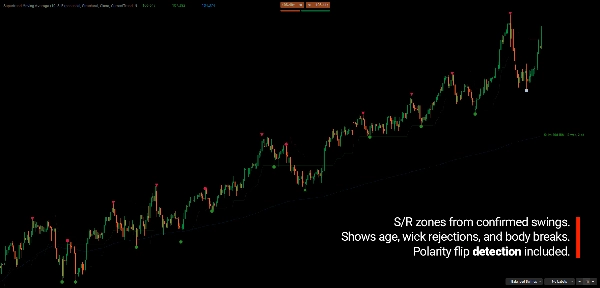
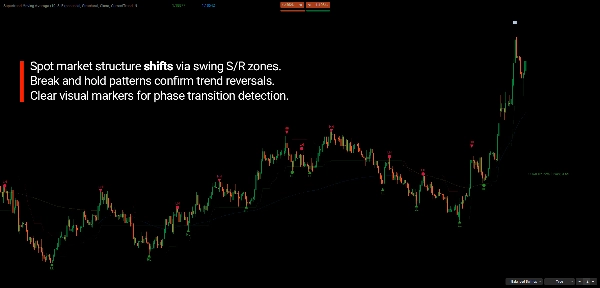
- 摆动区域和自动支撑/阻力
- 摆动极性
- 摆动关系
这些为自适应移动平均线周围提供额外的价格几何信息,而不改变其核心计算。
摆动点和支撑/阻力可独立切换(支撑/阻力需摆动点)。当摆动点关闭时,支撑/阻力选择保持,重新开启时继续生效。
输出显示
选择绘制内容:移动平均线、结构性超级趋势、原始超级趋势、摆动和支撑/阻力。默认开启移动平均线、结构性和原始超级趋势;摆动和支撑/阻力关闭。
- 隐藏输出也跳过其计算。关闭移动平均线时,所有移动平均线工作(本地和高时间框架,包括加载高时间框架柱)跳过;关闭摆动时,摆动检测和渲染跳过。
- 点状原始超级趋势仅在与结构性不同处显示,即使结构线隐藏也显示。
- 摆动偏移范围为-100至-1(默认-1)。支撑/阻力显示或隐藏由支撑/阻力开关控制。
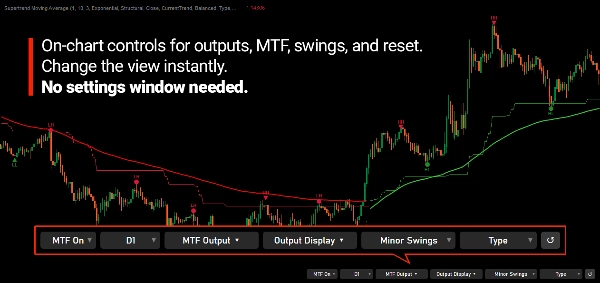
图表内控件
无需重新打开参数对话框即可更改显示内容:
- 输出显示 – 移动平均线、结构性超级趋势、原始超级趋势、摆动和支撑/阻力的复选框。至少保持移动平均线、结构性超级趋势、原始超级趋势或摆动之一选中。
- MTF – 开/关,高时间框架时间,MTF输出(移动平均线、超级趋势、摆动;至少保持一个选中)。更改立即生效,无需重载指标:移动平均线、超级趋势和摆动按需重建。
- 摆动控件 – 检测模式、标签显示和支撑/阻力偏移。摆动关闭时隐藏控件,摆动和支撑/阻力对象从图表移除;偏移按钮仅在摆动和支撑/阻力均开启时显示。
- 重置按钮 (↺) – 恢复所有控件,包括MTF和摆动控件,至参数对话框默认值。
- 保存设置 – 图表内选择(包括MTF和摆动控件)按符号和实例ID保存,下次恢复。对话框参数更改优先于保存值。
- 实例ID – 使用不同ID为同一符号的多个实例保持独立设置。
- 切换 – 开启移动平均线时重建(本地和高时间框架),关闭时清除。切换任一超级趋势仅刷新其自身输出。
你可以观察到的内容
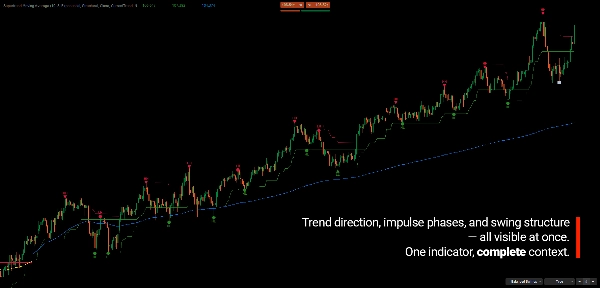
该指标旨在使以下内容可见:
- 当前趋势方向
- 趋势持续时间
- 趋势结构变化
- 回调和修正
- 修正后的延续
- 高时间框架背景
- 自适应均线周围的价格行为变化
移动平均线是测量工具,不是独立的买卖系统。
为自适应测量而设计
目的不是找到一个完美的移动平均周期。
而是消除一个固定周期应始终适用于整个趋势的假设。
新趋势和成熟趋势是同一运动的不同阶段。
移动平均线适应这种发展,而不是对两个阶段一视同仁。
目标不是持续优化固定移动平均周期。周期自动根据趋势结构和已发生的价格运动发展。
主要特征
- 基于趋势结构的自适应移动平均线
- 基于前一趋势极端收盘价的结构锚点
- 有效移动平均线长度随新趋势发展
- 趋势变化时自动结构重置
- 多种移动平均计算方法
- 结构性超级趋势视图
- 原始超级趋势视图
- 结构性与反应性趋势视图之间的上下文
- 可选摆动信息和自动支撑/阻力
- HH / HL / LH / LL 分类
- 摆动强度和区域
- 移动平均线、超级趋势和摆动点的多时间框架,彼此独立
- 高时间框架可低于、等于或高于图表时间框架
- 高时间框架柱形成期间的实时超级趋势
- 图表上的输出显示和MTF控件
- 重置按钮、保存设置和实例ID
- 高时间框架移动平均线的自动图表历史加载
- 可定制显示
须知
- 高时间框架移动平均线在高时间框架柱首次出现时评估一次,因此在该柱形成期间不变。高时间框架超级趋势实时更新。
- “加载更多N根柱”警告和自动历史加载仅适用于高时间框架移动平均线。
- 摆动间距为固定点值,因此高时间框架摆动的标记偏移可能看起来较小。
- 摆动重新计算在UI线程运行,因此历史非常长的图表在摆动重新计算时可能短暂冻结。
- 从100摆动历史中修剪的摆动保留其图表对象。
---
该指标是市场分析工具,不提供财务建议或保证交易结果。
摘要
The indicator integrates dual Supertrend analyses: a Structural Supertrend that identifies major trend direction by filtering out noise and confirming genuine directional changes, and the Original Supertrend that highlights momentum shifts within the trend. Comparing these two provides context for distinguishing strong trend continuation from corrective movements.
Key features include:
- Adaptive anchor-based moving averages with options for Simple, Exponential, or Arnaud Legoux (ALMA) types.
- Multi-timeframe capability to apply higher timeframe Supertrend context on lower timeframe charts.
- Integrated swing detection with configurable modes and strength classification.
- Color-coded trend lines and swing markers for clear visual interpretation.
This tool is suited for trend and swing traders, multi-timeframe analysts, and discretionary traders seeking a structural framework to track trend development and market rhythm objectively. It emphasizes market structure and context over fixed signals, supporting clearer interpretation of price behavior.
客户评价
5 | 67 % | |
4 | 33 % | |
3 | 0 % | |
2 | 0 % | |
1 | 0 % |
讨论
常见问答






















价格
