Description
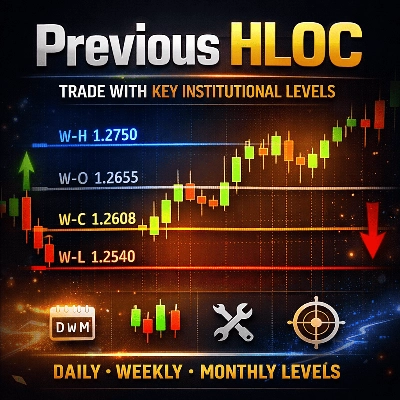
Previous HLOC – Smart Higher-Timeframe Levels for Precision Trading
Previous HLOC is a professional multi-timeframe indicator that plots the previous period’s High, Low, Open, and Close levels directly on your chart with unmatched clarity and customization.
Designed for price-action traders, scalpers, intraday traders, and swing traders, this indicator helps you instantly identify key institutional levels that often act as support, resistance, rejection zones, and liquidity targets.
Why Previous HLOC?
Markets consistently react to previous day, week, and month levels. Institutions, algorithms, and professional traders track these levels closely.
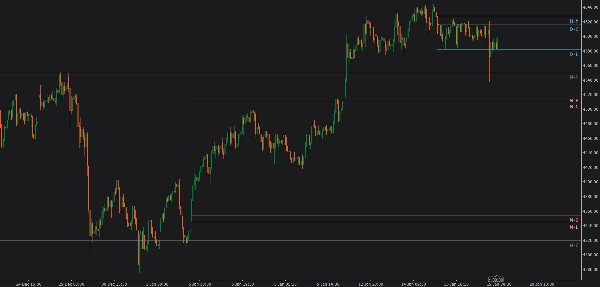
Previous HLOC brings those critical prices onto your chart in a clean, distraction-free way—so you never miss them.
Key Features
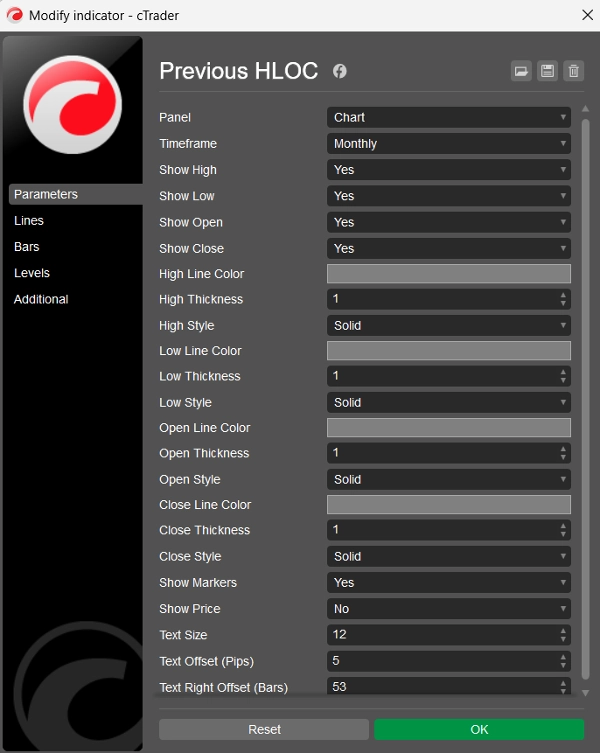
✅ Multi-Timeframe Levels
- Choose Daily, Weekly, Monthly, or Hourly previous candle levels
- Levels remain accurate regardless of your chart timeframe
✅ Full HLOC Control
- Enable or disable High, Low, Open, Close individually
- Trade only what matters to your strategy
✅ Advanced Customization
- Separate color, thickness, and line style for each level
- Clean Consolas font markers with adjustable text size
- Optional price display next to each marker
✅ Smart Floating Markers
- Markers move naturally with the chart
- Always remain aligned with the price level while scrolling
- Positioned to the right side for clear visibility
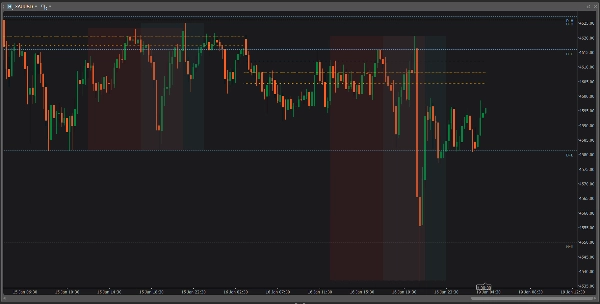
✅ Future-Projected Levels
- Lines extend far into the future
- Ideal for planning entries, exits, stop-loss, and take-profit levels
🔹 How Traders Use It
📌 Identify strong intraday support & resistance
📌 Use previous High/Low as liquidity sweep zones
📌 Trade breakouts, rejections, and retests
📌 Align entries with higher-timeframe bias
📌 Improve risk-reward precision
🔹 Who Is This Indicator For?
✔ Forex traders
✔ Index & commodity traders
✔ Scalpers and day traders
✔ Swing traders
✔ Price-action & SMC traders
🔹 Clean. Fast. Reliable.
- No repainting
- No lag
- No clutter
- Works on all symbols and all timeframes
🔹 Summary
Previous HLOC is not just another level indicator—it’s a professional trading tool that helps you trade with context, structure, and confidence.
If you trade around previous session levels, this indicator belongs on your chart.
Summary
Customer reviews
5 | 100 % | |
4 | 0 % | |
3 | 0 % | |
2 | 0 % | |
1 | 0 % |


