
说明
✅ 识别 超买和超卖状态 通过归一化动量
✅ 使用 平滑的基于EMA的中心价格 以生成稳定信号
✅ 显示 双重直方图(Oo 和 Ll) 以可视化动量压力
✅ 颜色编码的柱状图即时显示 看涨、看跌或犹豫不决 阶段
✅ 标记 精确的买入和卖出点 通过严格的交叉箭头
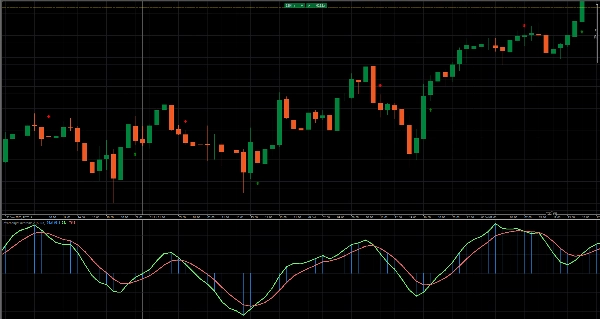
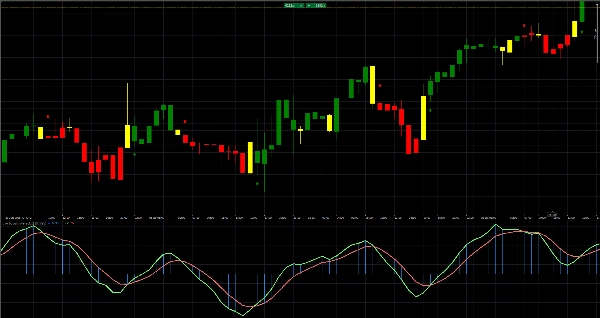
通过 超买/超卖指标 提升您的时机把握:它通过EMA计算平滑的中心价格(ys1),通过标准差归一化动量,并绘制双重直方图(Oo 和 Ll)以及上下EMA线。颜色编码的柱状图即时突出显示看涨(绿色)、看跌(红色)或犹豫不决(黄色)的动量变化,而严格的交叉箭头标记精确的买入和卖出点。将此叠加添加到您的图表中,获得清晰的超买/超卖信号,自信地把握进出场时机!
摘要
AI 摘要
The Overbought / Oversold Indicator is a technical analysis tool designed to identify overbought and oversold market conditions using normalized momentum. It calculates a smoothed central price via an exponential moving average (EMA) and normalizes momentum through standard deviation. The indicator displays dual histograms (Oo and Ll) alongside up/down EMA lines to visualize momentum pressure. Color-coded bars indicate bullish (green), bearish (red), or indecisive (yellow) momentum phases, providing clear visual cues. Additionally, strict crossover arrows mark precise buy and sell points to assist in timing entries and exits. This overlay can be applied to various markets including forex, commodities, indices, stocks, and cryptocurrencies, supporting symbols such as GBPUSD, EURUSD, USDJPY, XAUUSD, BTCUSD, and NAS100. The indicator integrates concepts related to RSI, MACD, Bollinger Bands, Fibonacci levels, and other momentum and trend tools. It is suitable for traders employing strategies like scalping, breakout, martingale, grid, and smart money concepts. The indicator is also available as a cBot for automated trading on the cTrader platform.
指标配置
客户评价
5.0
评价:2
5 | 100 % | |
4 | 0 % | |
3 | 0 % | |
2 | 0 % | |
1 | 0 % |
客户评价
July 25, 2025
It helped mostly by making bad ideas easier to skip, and It needs a boring test before bigger size.
July 13, 2025
讨论
常见问答
Signal
Indices
Commodities
GBPUSD
RSI
Bollinger
Fibonacci
Scalping
AI
XAUUSD
NAS100
MACD
BTCUSD
Forex
Breakout
EURUSD
NZDUSD
Martingale
Prop
ZigZag
Supertrend
Fair Value Gap
SMC
Crypto
Grid
Stocks
ATR
USDJPY
VWAP
cTrader Store 提供的所有产品,包括交易机器人、指标和插件,均由第三方开发者提供,仅供信息参考和技术访问之用。cTrader Store 并非经纪商,不提供投资建议、个人推荐或任何未来业绩保证。
该作者的其他作品


!["[Stellar Strategies] Inside Bar with Signals" 标识](https://cdn.ctrader.com/image/webp/1d9e8bfa-3b2c-4440-bb37-5856902008a7_30683)


价格
60
销售
945
免费安装