
Description
📊 TrendHeikinMultiMA – Algorithme de tendance avancé
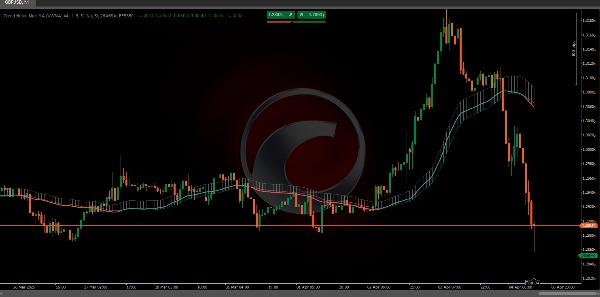
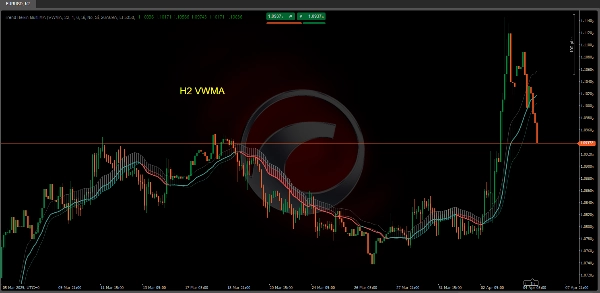
L’algorithme TrendHeikinMultiMA est conçu pour calculer des valeurs de tendance à partir des données de prix, en utilisant la formule Heikin-Ashi pour lisser ces valeurs et en appliquant différents types de moyennes mobiles (ALMA, HMA, SMA, SWMA, VWMA, WMA, ZLEMA, ou EMA).
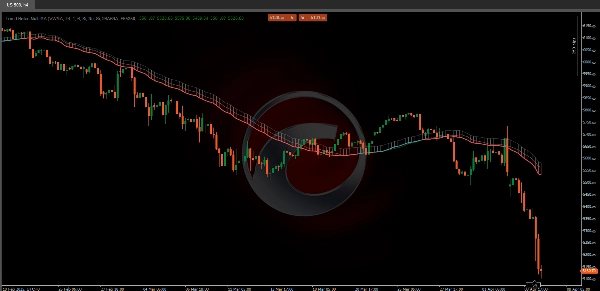
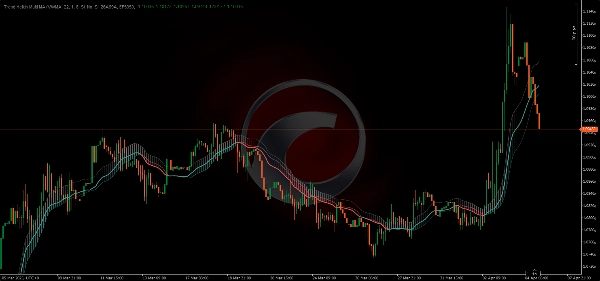
Bien que les valeurs Heikin-Ashi soient utilisées en interne, le graphique n’affiche pas les chandeliers Heikin-Ashi traditionnels. À la place, il trace des lignes de tendance basées sur les valeurs lissées, facilitant l’interprétation de la direction du marché sans la complexité visuelle des graphiques en chandeliers.
🔄 1. Le rôle du lissage
Puisque les valeurs de tendance sont dérivées du lissage Heikin-Ashi combiné à une moyenne mobile, le changement de couleur dans TrendHeikinMultiMA ne se produit pas immédiatement lorsque le prix croise la ligne de tendance :
- 🔹 Le prix peut temporairement se déplacer au-dessus ou en dessous de la ligne de tendance sans déclencher de changement de couleur.
- 🔹 Cela se produit parce que l’indicateur attend une différence significative et soutenue entre les valeurs lissées d’ouverture et de clôture pour confirmer un véritable renversement de tendance.
✅ Avantage dans l’interprétation
Ce délai intentionnel dans le changement de couleur aide à éviter les faux signaux. Dans un graphique en chandeliers traditionnel, le prix pourrait brièvement franchir la ligne de tendance et déclencher des signaux prématurés.
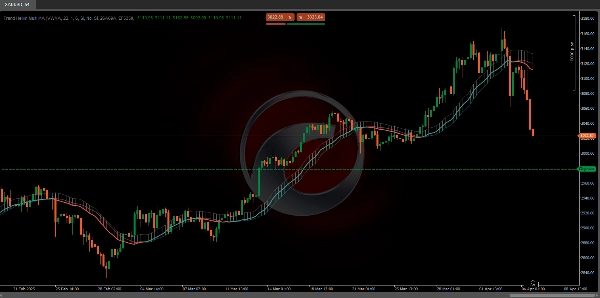
- 🟥 Par exemple, même si le prix actuel est au-dessus d’une ligne de tendance baissière, l’indicateur restera rouge (baissier) jusqu’à ce que les valeurs lissées confirment que la clôture est constamment supérieure à l’ouverture.
- 🟩 De même, pour passer au vert (haussier), la moyenne mobile basée sur Heikin-Ashi doit confirmer que la clôture dépasse constamment l’ouverture.
📈 2. Application des moyennes mobiles aux valeurs Heikin-Ashi
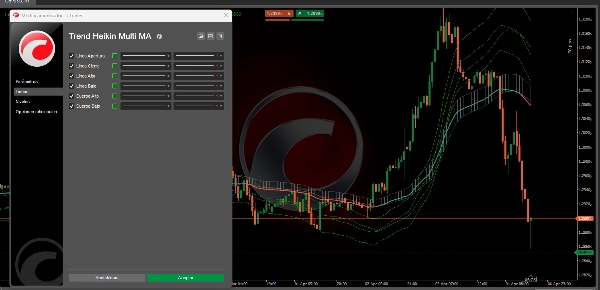
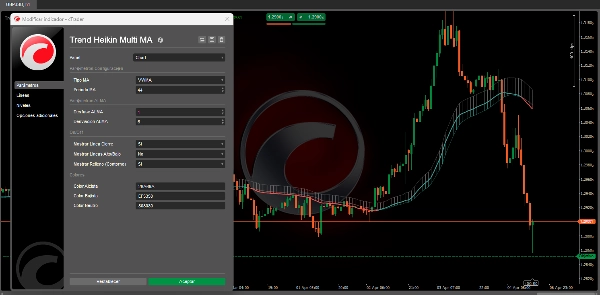
- 🔄 Sélection de la moyenne mobile :
-
- L’utilisateur peut choisir entre différents types de moyennes mobiles (ALMA, HMA, SMA, SWMA, VWMA, WMA, ZLEMA, et EMA).
- Chaque type de MM applique une méthode mathématique spécifique pour pondérer et lisser les valeurs historiques de l’ouverture, clôture, haut et bas dérivées de Heikin-Ashi.
🏆 3. Avantages de l’utilisation de TrendHeikinMultiMA vs. chandeliers traditionnels
- 📉 Réduction du bruit :
-
- Les chandeliers traditionnels affichent souvent une forte volatilité et des données dispersées, rendant plus difficile l’identification de la tendance générale.
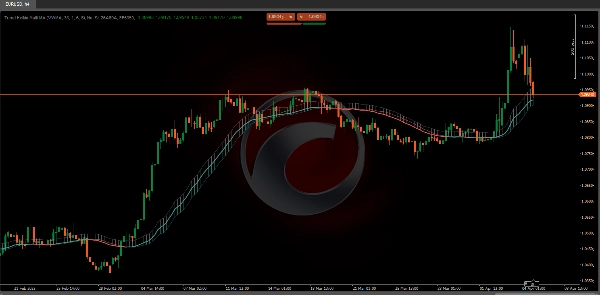
- TrendHeikinMultiMA lisse ces données, filtrant les fluctuations mineures et éliminant les variations brusques, permettant aux traders de se concentrer sur la direction principale du marché.
✅ Conclusion
En résumé, TrendHeikinMultiMA confirme un changement de tendance (haussière ou baissière) uniquement lorsque les valeurs lissées d’ouverture et de clôture—calculées à partir de Heikin-Ashi et traitées via la moyenne mobile sélectionnée—montrent de manière constante que le comportement du marché a inversé sa direction.
Cela garantit que les signaux sont plus fiables et moins affectés par le bruit observé dans les graphiques en chandeliers traditionnels. 🚀📊
🔥 Indicateurs Pinescritlabs Ctrader Store 🔥
Dynamic Market Structure
Analysis of Turning Points
Fibonacci Linear
Regression Multi-timeframe
Multi-Level Candle Bias
Tracker
Auto Support and
Resistance Trend Lines
All Support and
Resistance Levels
Résumé
Avis clients
5 | 33 % | |
4 | 67 % | |
3 | 0 % | |
2 | 0 % | |
1 | 0 % |


