
Описание
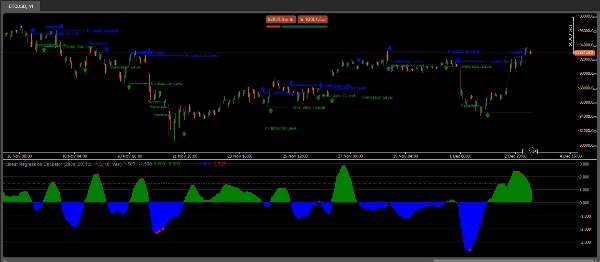
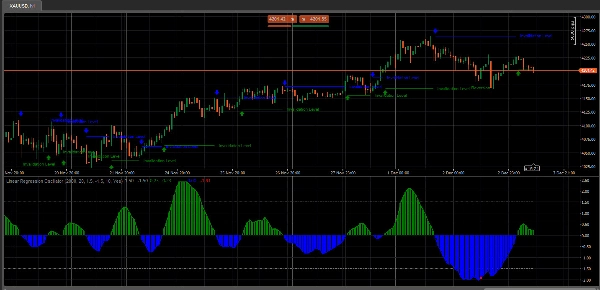
Линейный регрессионный осциллятор (LRO) (Linear Regression Oscillator (LRO)) — это технический индикатор, основанный на анализе линейной регрессии, который обычно используется на финансовых рынках для оценки импульса и направления ценовых трендов. Он измеряет расстояние между текущей ценой и значением, предсказанным линией линейной регрессии, которая по сути является линией наилучшего соответствия за определённый период. Вот разбор того, как он работает и его компоненты:
Ключевые компоненты линейного регрессионного осциллятора
- Линия линейной регрессии (линия наилучшего соответствия): Эта линия представляет ожидаемое движение цены за определённый период и рассчитывается с использованием методов линейной регрессии. Наклон линии указывает направление тренда: положительный наклон говорит о восходящем тренде, а отрицательный — о нисходящем.
- Значения осциллятора: Значение осциллятора рассчитывается путем измерения отклонения между текущей ценой и линией линейной регрессии. Это отклонение отображается как значение осциллятора, обычно колеблющееся вокруг нулевой линии.
- Нулевая линия: Нулевая линия на графике LRO служит базовой линией. Когда значение осциллятора пересекает нулевую линию сверху вниз, это указывает на медвежий импульс, а пересечение снизу вверх — на бычий.
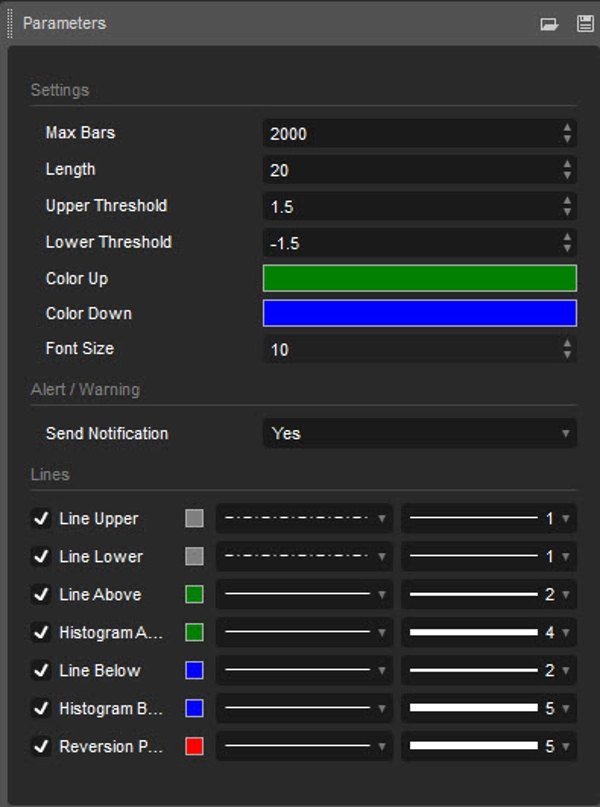
- Настройки и периоды: Настройка периода определяет количество баров или точек данных, учитываемых при расчёте линии линейной регрессии. Трейдеры регулируют эту настройку в зависимости от краткосрочных или долгосрочных торговых стратегий и предпочитаемого временного интервала анализа.
Как трейдеры используют линейный регрессионный осциллятор
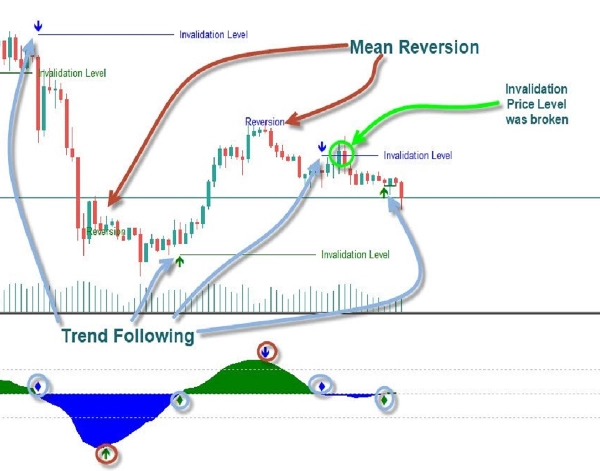
- Определение трендов: LRO помогает трейдерам увидеть, есть ли у текущего ценового тренда импульс, показывая относительное расстояние между ценой и её ожидаемой (регрессионной) линией.
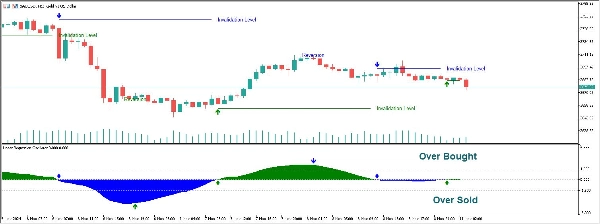
- Уровни перекупленности/перепроданности: Экстремальные значения осциллятора могут указывать на состояния перекупленности или перепроданности, что предполагает возможный разворот или необходимость корректировки позиций.
- Сигналы дивергенции: Когда движения цены и индикатор LRO расходятся, это может сигнализировать о снижении импульса или возможном развороте.
Советы по интерпретации
- Пересечение нулевой линии: Пересечение выше нуля может указывать на формирующийся восходящий тренд, а пересечение ниже нуля — на нисходящий.
- Настройка периодов: Более короткие периоды делают LRO более чувствительным, улавливая быстрые ценовые движения, но увеличивая шум. Более длинные периоды сглаживают колебания, что подходит для определения долгосрочных трендов.
Примечания по использованию:
- Длина: Определяет период, за который рассчитывается линейная регрессия
- Верхний/нижний порог: Определяют верхние и нижние границы для выявления состояний перекупленности и перепроданности. Значения за пределами этих порогов указывают на возможные развороты.
Линейный регрессионный осциллятор ценится за сочетание статистического анализа с принципами следования за трендом, что делает его универсальным инструментом как для трейдеров, ориентированных на импульс, так и для тех, кто следует за трендом. Он особенно полезен на трендовых рынках, где помогает выявлять продолжения тренда или развороты на основе отклонений от линии регрессии.
Сводка
Отзывы покупателей
5 | 0 % | |
4 | 100 % | |
3 | 0 % | |
2 | 0 % | |
1 | 0 % |


