
Multi Timeframe Trend Dots — это мощный и минималистичный индикатор тренда, созданный для cTrader. Он позволяет трейдерам визуально отслеживать направление тренда на до 4 выбранных таймфреймах с помощью простых, но эффективных цветных точечных линий.
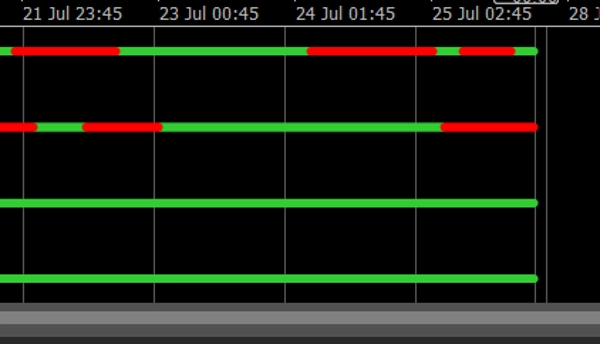
✅ Зеленый = Восходящий тренд
✅ Красный = Нисходящий тренд
✅ Чистый интерфейс в одном дополнительном окне
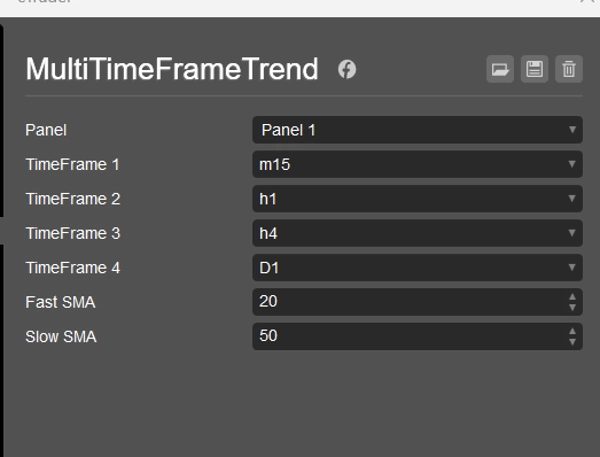
✅ Настраиваемые параметры быстрых/медленных SMA
✅ Работает на любом инструменте и таймфрейме
Будь вы скальпером, внутридневным трейдером или свинг-трейдером, этот индикатор дает вам быстрый обзор согласования нескольких таймфреймов — идеально подходит для уверенного входа в сделки или фильтрации плохих сигналов.
💼 Включает:
- Логика тренда на основе пересечения SMA
- Размещение точек на 4 уровнях (отрегулировано для удобочитаемости)
- Метки таймфреймов в конце каждой линии тренда
- Полная совместимость со всеми версиями cTrader
🎁 Идеальный помощник для построения стратегий или ручной торговли.
5 | 0 % | |
4 | 100 % | |
3 | 0 % | |
2 | 0 % | |
1 | 0 % |


