
Description
Cet indicateur est conçu pour effectuer une analyse de régression non linéaire multiple en utilisant quatre variables indépendantes : les prix de clôture, d'ouverture, les plus hauts et les plus bas.
Voici les composants et fonctionnalités :
Entrées :
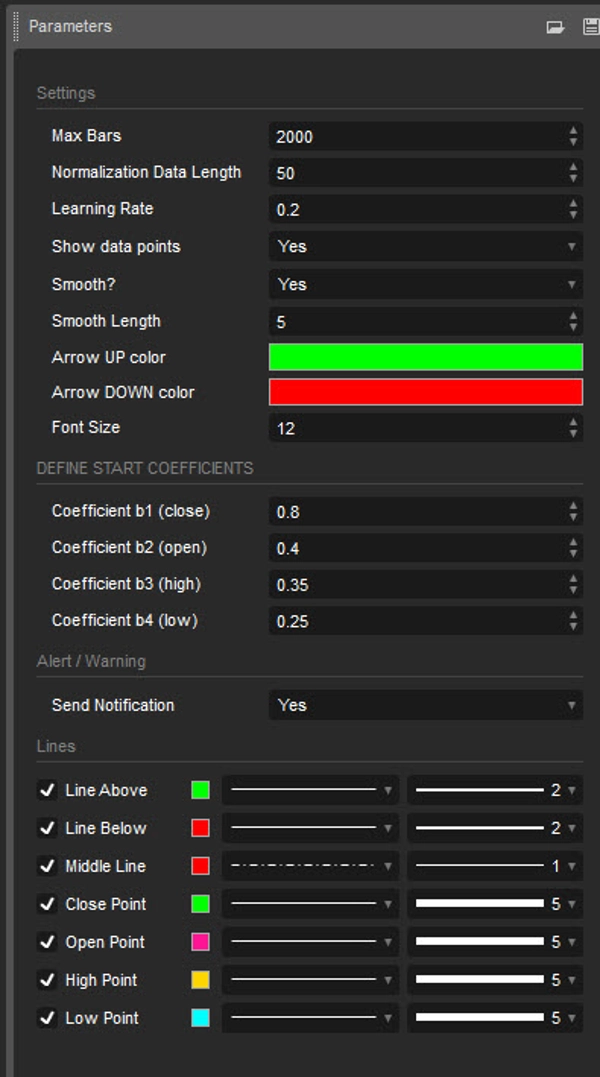
- Longueur des données de normalisation : longueur des données utilisées pour la normalisation.
- Taux d'apprentissage : taux auquel l'algorithme apprend des erreurs.
- Afficher les points de données : afficher le tracé des données d'entrée normalisées (close, open, high, low)
- Lissage ? : option pour lisser la sortie.
- Longueur du lissage : longueur du lissage si activé.
- Définir les coefficients de départ : coefficients initiaux pour l'équation de régression.
Normalisation des données :
Le script normalise les données d'entrée dans une plage comprise entre 0 et 1 en utilisant les valeurs les plus hautes et les plus basses sur une longueur spécifiée.
Régression non linéaire :
Il calcule l'équation de régression en utilisant les coefficients d'entrée et les données normalisées. L'équation utilisée est une somme pondérée des variables indépendantes, avec des coefficients ajustés itérativement à l'aide de la descente de gradient pour minimiser les erreurs.
Calcul de l'erreur :
Le script calcule l'erreur entre les valeurs réelles et prédites.
Descente de gradient :
Les coefficients sont mis à jour de manière itérative en utilisant la descente de gradient pour minimiser l'erreur.
Visualisation :
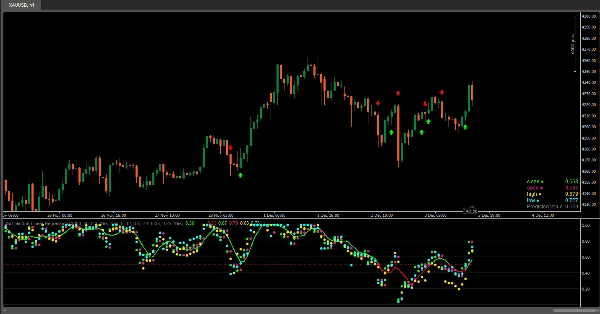
- Tracé des données d'entrée normalisées (close, open, high, low).
- L'indicateur fournit une visualisation des valeurs de données normalisées (close, open, high, low) sous forme de marqueurs circulaires sur le graphique, permettant aux utilisateurs d'observer facilement les positions relatives de ces valeurs entre elles et par rapport à la ligne de régression.
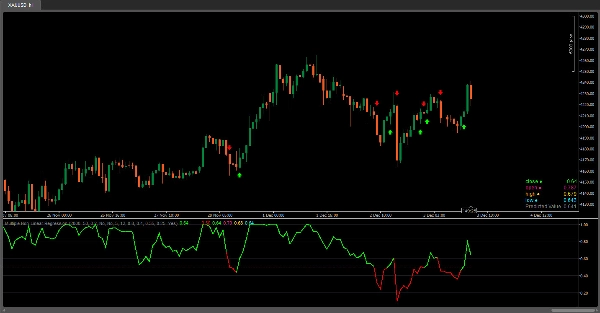
- Tracé de la ligne de régression.
- Dégradé de couleur sur la ligne de régression basé sur sa valeur et les couleurs des barres.
- Affichage des données d'entrée normalisées et de la valeur prédite dans un tableau.
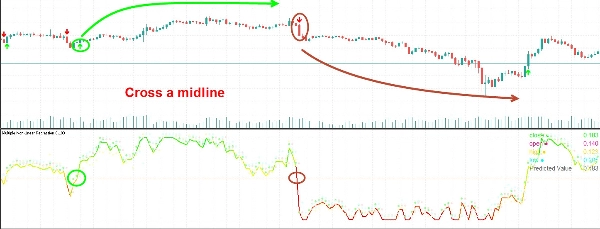
- Signaux pour les croisements avec une ligne médiane (0,5).
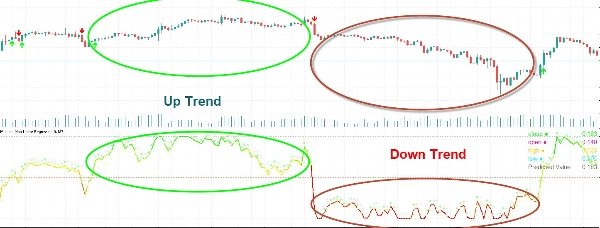
Interprétation :
Les utilisateurs peuvent interpréter la ligne de régression et ses croisements avec la ligne médiane (0,5) comme des signaux pour des opportunités potentielles d'achat ou de vente.
Cet indicateur aide les utilisateurs à analyser la relation entre plusieurs variables et à prendre des décisions de trading basées sur l'analyse de régression. L'ajustement des coefficients et des paramètres peut affiner les performances du modèle selon les conditions spécifiques du marché.
Résumé
Avis clients
5 | 100 % | |
4 | 0 % | |
3 | 0 % | |
2 | 0 % | |
1 | 0 % |


