
Description
https://chartshots.spotware.com/c/695be69b1a3ca
https://chartshots.spotware.com/c/695be2a98e848
https://chartshots.spotware.com/c/695be7e8e88fa
https://chartshots.spotware.com/c/695be31346fe7
https://chartshots.spotware.com/c/695be3bd18aea
https://chartshots.spotware.com/c/695be5d5687c7
Modèles Automatiques de Graphiques
📊 QU'EST-CE QUE C'EST ?
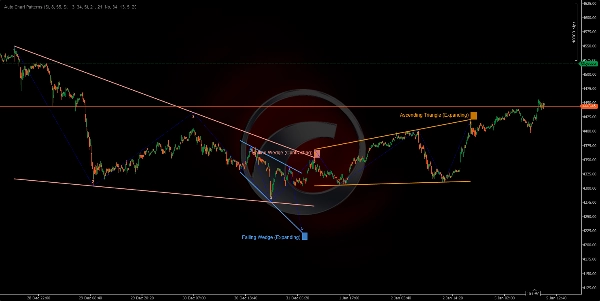
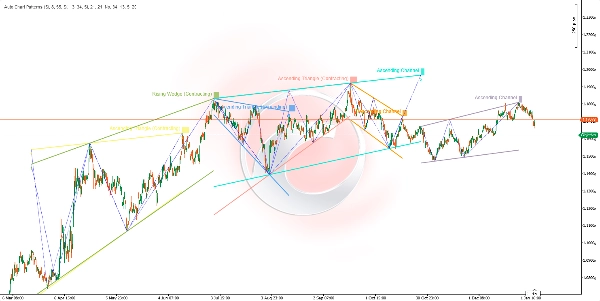
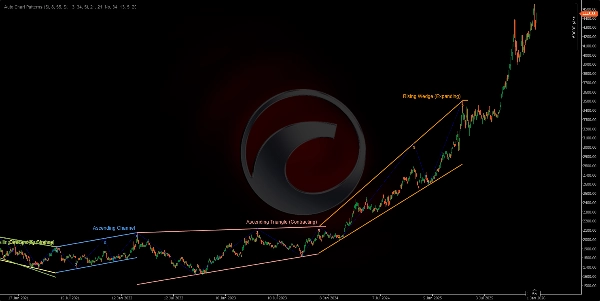
L'indicateur Auto Chart Patterns est un scanner avancé de formations géométriques qui détecte et visualise automatiquement les modèles classiques de graphiques en utilisant une analyse des points de pivot multi-échelles. Il identifie 14 formations géométriques différentes dont des canaux, des coins et des triangles en reliant les sommets et creux avec des lignes de tendance, créant ainsi un système complet de reconnaissance de motifs.
🎯 À QUOI ÇA SERT ?
Cet indicateur aide les traders à :
- Détecter automatiquement 14 modèles classiques de graphiques (canaux, coins, triangles) 📐
- Identifier les zones potentielles de cassure avant qu'elles ne se produisent ⚡
- Visualiser la structure du marché à travers les relations géométriques des prix 🔍
- Trader les modèles de continuation et de retournement avec confirmation visuelle ✅
- Filtrer les modèles par direction de tendance et type de pivot final 🎛️
- Analyser plusieurs périodes de swing simultanément pour la confluence 🌊
🔍 COMMENT ÇA FONCTIONNE ?
Système de Détection des Points de Pivot 📍
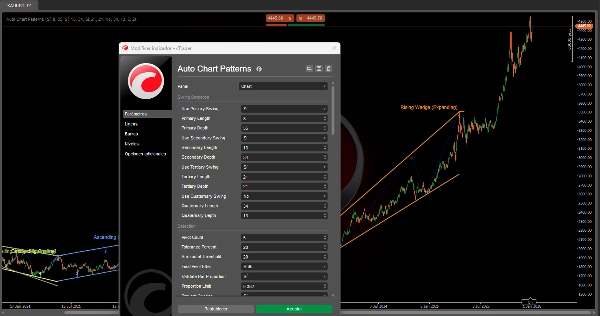
L'indicateur utilise jusqu'à quatre détecteurs de swing indépendants fonctionnant simultanément, chacun avec une sensibilité configurable :
- Logique de Détection :
-
- Surveille les hauts et bas des prix sur une fenêtre glissante (Période).
- Identifie les pics locaux (swing highs) et creux (swing lows).
- Confirme les swings seulement après qu'une profondeur minimale est atteinte (évite le bruit).
- Swing Haut : Le prix fait le plus haut dans la Période, puis baisse pendant
MinDepthbarres. - Swing Bas : Le prix fait le plus bas dans la Période, puis monte pendant
MinDepthbarres.
- Quatre Couches de Swing :
-
- Swing Primaire (Par défaut : Longueur 8, Profondeur 55) - Structure à long terme 🔵
- Swing Secondaire (Par défaut : Longueur 13, Profondeur 34) - Structure à moyen terme 🟢
- Swing Tertiaire (Par défaut : Longueur 21, Profondeur 21) - Structure à court terme 🟡
- Swing Quaternaire (Par défaut : Désactivé) - Période personnalisée 🟣
Chaque détecteur peut être activé/désactivé indépendamment pour se concentrer sur des structures de marché spécifiques.
Processus de Formation des Modèles 🎨
ÉTAPE 1 - COLLECTE DES PIVOTS :
- Le système collecte les 5 ou 6 points de swing les plus récents de n'importe quel détecteur actif.
- Les points doivent alterner entre hauts et bas (structure en zigzag).
- Exemple à 5 points : Haut → Bas → Haut → Bas → Haut.
ÉTAPE 2 - CONSTRUCTION DES LIGNES DE TENDANCE :
- Sépare les pivots en points supérieurs (swing highs) et points inférieurs (swing lows).
- Trace deux lignes de tendance : limite supérieure et limite inférieure.
- Pour les limites à 3 points : teste 3 combinaisons (0-2, 0-1, 1-2) et sélectionne la meilleure correspondance ⭐
- Valide que les lignes de tendance ne pénètrent pas les corps des chandeliers (seules les mèches sont autorisées).
- Calcule un score d'ajustement : les lignes doivent toucher < 20% des barres entre les pivots.
ÉTAPE 3 - ANALYSE GÉOMÉTRIQUE :
- Mesure la relation angulaire entre les limites supérieure et inférieure.
- Détermine si la formation est Expansive (s'élargissant), Contractante (se rétrécissant), ou Parallèle (largeur constante).
- Identifie la direction de la tendance : Haussière, Baissière ou Neutre (horizontale).
- Classe dans l'un des 14 types de formation selon la géométrie.
ÉTAPE 4 - VALIDATION & FILTRAGE :
- Vérification de la Proportion des Barres : Assure que l'espacement des swings est proportionnel (évite les modèles déformés) ✅
- Prévention des Chevauchements : Bloque les nouveaux modèles qui entrent en conflit avec les existants 🚫
- Vérification des Doublons : Empêche le redessin du même modèle.
- Filtre du Pivot Final : Affiche uniquement les modèles se terminant par une direction de pivot spécifiée (Haut/Bas/Les deux).
- Filtre du Type de Formation : Active/désactive des catégories spécifiques de modèles.
ÉTAPE 5 - VISUALISATION :
- Trace les lignes de limite supérieure et inférieure en couleurs vives à partir d'une palette de 12 couleurs 🎨
- Affiche optionnellement les lignes de swing en zigzag reliant les pivots (pointillé bleu).
- Montre les numéros des pivots (1, 2, 3, 4, 5) à chaque point de swing.
- Étiquette la formation avec le nom du modèle au pivot final.
- Code couleur l'arrière-plan derrière l'étiquette pour plus de clarté.
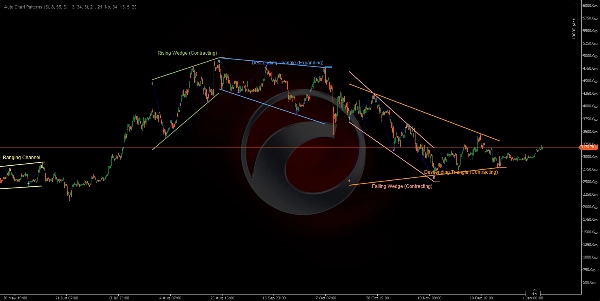
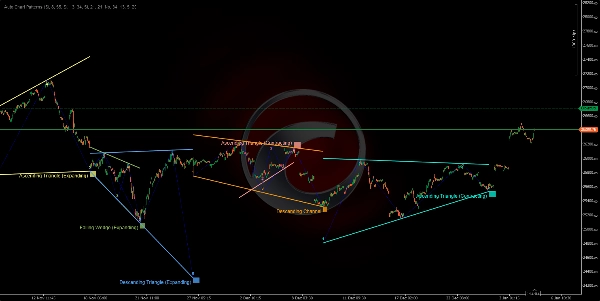
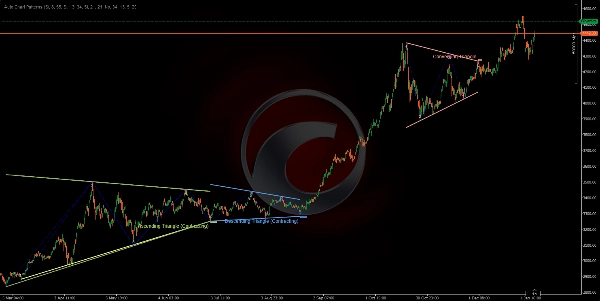
📐 LES 14 FORMATIONS DÉTECTÉES
CANAUX (Formations Parallèles) 📦
- Canal Ascendant (Parallèle Ascendant) 📈
-
- Les deux limites montent à un angle similaire.
- Indique une tendance de continuation haussière.
- Trade : Acheter à la limite inférieure, vendre à la limite supérieure.
- Canal Descendant (Parallèle Descendant) 📉
-
- Les deux limites descendent à un angle similaire.
- Indique une tendance de continuation baissière.
- Trade : Vendre à la limite supérieure, acheter à la limite inférieure.
- Canal Latéral (Latéral/Horizontale) ↔️
-
- Les deux limites sont presque horizontales.
- Indique une consolidation ou une indécision.
- Trade : Stratégie de range, acheter au support/vendre à la résistance.
COINS EXPANSIFS (Formations Élargissantes) 📣
4. Coin Ascendant (Expansif) ⚠️
* Les deux limites montent, avec un écart qui s'élargit.
* Modèle de retournement baissier - perte de momentum haussier.
* Trade : Attendre la cassure de la limite inférieure, entrer en position courte.
5. Coin Descendant (Expansif) ⚠️
* Les deux limites descendent, avec un écart qui s'élargit.
* Modèle de retournement haussier - perte de momentum baissier.
* Trade : Attendre la cassure de la limite supérieure, entrer en position longue.
6. Triangle Divergent (Triangle Élargissant) 🔺
* La limite supérieure monte, la limite inférieure descend.
* Modèle d'expansion à haute volatilité.
* Trade : Extrêmement risqué, attendre une cassure directionnelle claire.
7. Triangle Ascendant (Expansif) 📊
* Limite supérieure horizontale, limite inférieure montante.
* Continuation haussière avec un range en expansion.
* Trade : Acheter la cassure de la limite supérieure.
8. Triangle Descendant (Expansif) 📊
* Limite inférieure horizontale, limite supérieure descendante.
* Continuation baissière avec un range en expansion.
* Trade : Vendre la cassure de la limite inférieure.
COINS CONTRACTIFS (Formations Convergentes) 🔻
9. Coin Ascendant (Contractif) 🔺
* Les deux limites montent, avec un écart qui se rétrécit.
* Modèle de retournement baissier - épuisement haussier ⚠️
* Trade : Position courte à la cassure de la limite inférieure.
10. Coin Descendant (Contractif) 🔻
* Les deux limites descendent, avec un écart qui se rétrécit.
* Modèle de retournement haussier - épuisement baissier ⚠️
* Trade : Position longue à la cassure de la limite supérieure.
TRIANGLES CONTRACTIFS (Formations de Consolidation) △
11. Triangle Convergent (Triangle Symétrique) ⚖️
* La limite supérieure descend, la limite inférieure monte à un rythme similaire.
* Consolidation neutre - modèle de continuation.
* Trade : Attendre la direction de la cassure, trader en conséquence.
12. Triangle Descendant (Contractif) 📐
* Limite inférieure horizontale (support), limite supérieure descendante.
* Modèle de continuation baissière 🔴
* Trade : Position courte à la cassure du support avec volume.
13. Triangle Ascendant (Contractif) 📐
* Limite supérieure horizontale (résistance), limite inférieure montante.
* Modèle de continuation haussière 🟢
* Trade : Position longue à la cassure de la résistance avec volume.
14. Invalide/Inconnu ❌
* Modèles ne répondant pas aux critères géométriques.
* Filtrés automatiquement.
Résumé
Key functionalities include identifying potential breakout zones, visualizing market structure through geometric price relationships, and supporting trading of continuation and reversal patterns with visual confirmation. Users can filter detected patterns by trend direction, pivot type, and formation category. The indicator prevents overlapping and duplicate patterns to maintain clarity.
The 14 detected formations cover a range of classical patterns such as ascending, descending, and ranging channels; expanding and contracting wedges; and various triangle types (converging, diverging, ascending, descending). Visual outputs include color-coded boundary lines, pivot numbering, zigzag swing lines, and labeled pattern names for easy interpretation. This tool supports analysis across multiple markets including Forex, stocks, commodities, indices, and cryptocurrencies.
Avis clients
5 | 50 % | |
4 | 50 % | |
3 | 0 % | |
2 | 0 % | |
1 | 0 % |


![Logo de "High-Low Divergence [Iridio Capital]"](https://cdn.ctrader.com/image/webp/443c4661-7abb-40f1-842f-4b6ec560649b_40914)

