
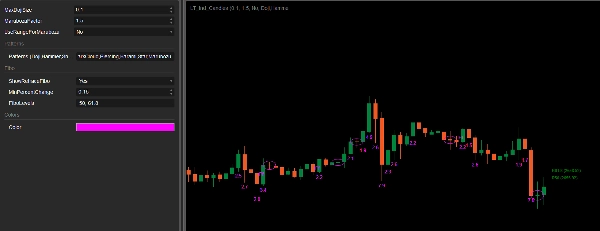
LT_Ind_Candles
Indicateur
4 achats
Version 1.0, Sep 2024
Windows, Mac
4.0
Avis : 1
Description
Note : testé uniquement sur cTrader Windows.
Modèles à une seule bougie :
- Doji
- Marteau
- Étoile filante
Modèles à 2 bougies :
- Engloutissement
- Nuage sombre
- Perforante
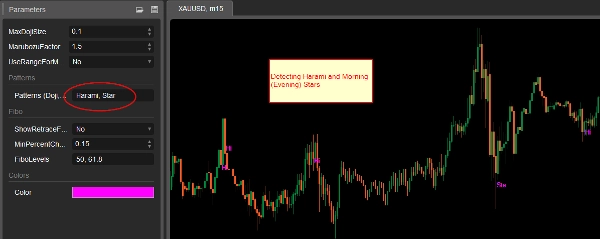
- Harami
Modèles à 3 bougies :
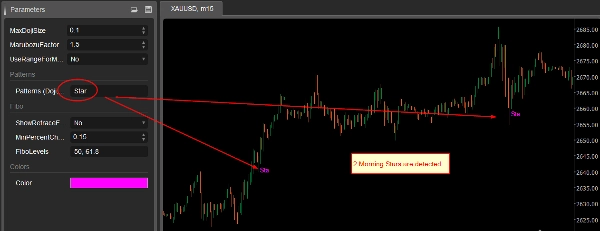
- Étoiles du matin
- Étoiles du soir
Marubozu :
Si sélectionné, la taille des bougies à grand corps est annotée. Lisez les descriptions des paramètres pour la taille.
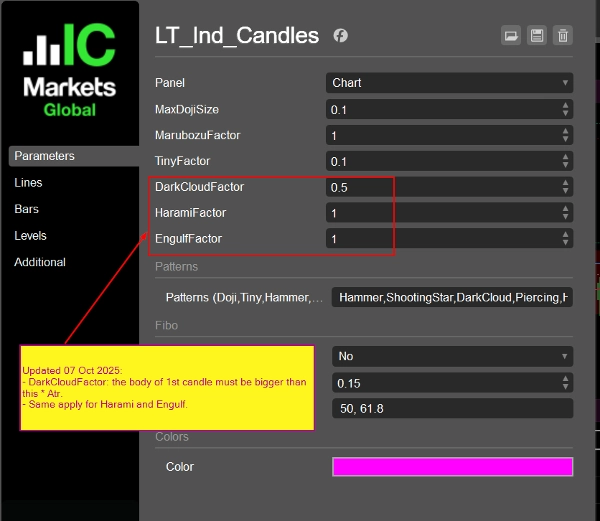
Paramètres :
(Mis à jour le 07 oct. 2025 :
- Utiliser Atr (14 périodes, moyenne mobile simple) au lieu de MedianBarBody
- Ajout des paramètres pour DarkCloud (et Piercing), Harami, facteurs d’Engulf
)
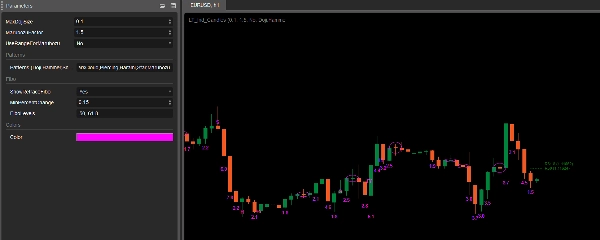
- MaxDojiSize : le ratio maximal entre le corps de la barre et la plage de la barre pour considérer un Doji (par défaut 0,1).
- Facteur Marubozu : le corps de la barre actuelle doit être > MarubozuFactor * Atr pour être considéré comme une grande bougie (Marubozu). La mèche n’est pas prise en compte ici.
- Utiliser la plage pour Marubozu : utiliser BarRange (Haut - Bas) au lieu de BarBody (Ouverture - Fermeture).MathAbs() lors de la vérification pour Marubozu.
- Modèles : indiquez les modèles que vous souhaitez détecter, séparés par des virgules. Les valeurs acceptées sont : Doji,Marteau,ÉtoileFilante,Engloutissement,NuageSombre,Perforante,Harami,Étoile,Marubozu. Notez que si vous choisissez "Étoile", les Étoiles du matin et du soir seront détectées.
- Afficher le retracement Fibo : des niveaux Fibo auxiliaires pour vous aider à contrôler le risque. Lorsqu’il y a 2 bougies consécutives avec des plus hauts et plus bas plus élevés, les niveaux Fibo spécifiés calculés à partir de ces 2 bougies sont tracés. Vous pouvez maintenir votre entrée jusqu’à ce que le prix atteigne ces niveaux pour contrôler le risque. Les niveaux sont réglables. Le côté opposé est identique (plus haut et plus bas plus bas).
- Changement de pourcentage minimum : les 2 bougies utilisées pour les niveaux Fibo doivent former un changement de prix > ce pourcentage.
- Niveaux Fibo : indiquez vos niveaux séparés par des virgules.
- Couleur : couleur de l’annotation de la bougie.
Résumé
Profil de l'indicateur
Avis clients
4.0
Avis : 1
5 | 0 % | |
4 | 100 % | |
3 | 0 % | |
2 | 0 % | |
1 | 0 % |
Discussion
Questions fréquentes
Forex
Signal
Indices
Commodities
Crypto
Stocks
ATR
Les produits disponibles sur cTrader Store, notamment les bots de trading, les indicateurs et les plug-ins, sont fournis par des développeurs tiers et mis à disposition à titre informatif et à des fins d'accès technique uniquement. cTrader Store n'est pas un courtier et ne fournit aucun conseil en investissement, aucune recommandation personnelle ni aucune garantie quant aux performances futures.


Prix
Depuis le 25/09/2024
34
Ventes