
Description
✅ Détecte les points de retournement à haute et basse probabilité grâce à une logique avancée de pivot
✅ Moteurs Profondeur, Déviation & Recul entièrement personnalisables
✅ Trace automatiquement des étiquettes claires ACHAT et VENTE sur le graphique
✅ Marqueurs de pivot et surlignages de la barre actuelle optionnels pour plus de clarté
✅ Conçu pour capturer les retournements précoces avec précision et confiance
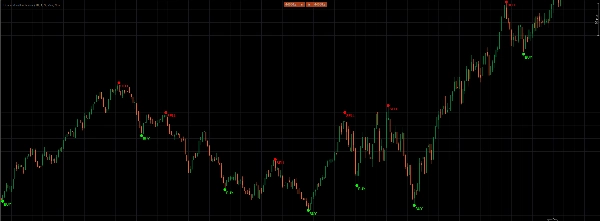
Libérez un trading précis avec le Buy & Sell Indicator : un moteur de signal puissant basé sur les pivots qui détecte les points de retournement hauts et bas en utilisant des réglages personnalisables de profondeur, déviation et recul. Configurez votre DepthEngine, DeviationEngine et BackstepEngine pour affiner la sensibilité, puis laissez l’indicateur tracer automatiquement des étiquettes claires « ACHAT » et « VENTE » — complétées par des marqueurs de pivot et de barre actuelle optionnels dans vos couleurs préférées — pour ne plus jamais manquer un retournement de tendance ! Tradez plus intelligemment, pas plus durement.
Résumé
Avis clients
5 | 33 % | |
4 | 67 % | |
3 | 0 % | |
2 | 0 % | |
1 | 0 % |


![Logo de "Gaussian Channel [Iridio Capital]"](https://cdn.ctrader.com/image/webp/7c039209-5573-4a54-a072-f9528b503103_41960)