
Description
✅ Ligne de tendance à changement de couleur fluide qui s'adapte instantanément à la direction
✅ Flèches haut & bas optionnelles pour des signaux clairs de changement de tendance
✅ Filtre le bruit pour mettre en évidence des transitions de tendance nettes et fiables
✅ Idéal pour le suivi de tendance, les replis et les retournements
✅ Entièrement personnalisable : période, sensibilité & affichage des flèches
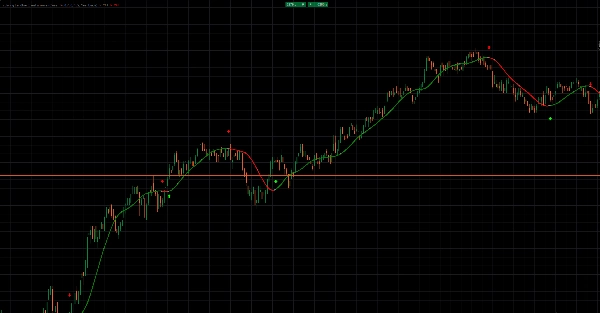
La ligne de tendance colorée avec flèches offre une vue fluide et réactive de la direction du marché sans encombrement.
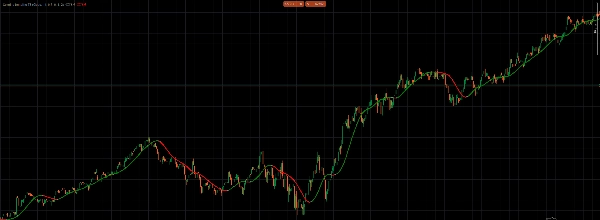
La ligne de tendance change dynamiquement en vert lors des phases haussières et en rouge lors des phases baissières, rendant la direction de la tendance immédiatement lisible.
Lorsque le momentum change, des flèches optionnelles marquent la transition — flèches vertes pour les tendances haussières, flèches rouges pour les tendances baissières.
Cela vous permet de saisir les pivots de tendance tôt tout en évitant les faux signaux causés par le bruit du marché.
Conçue pour la clarté, elle s'adapte en douceur au prix tout en maintenant une structure directionnelle forte.
Parfaite pour synchroniser les entrées, gérer les sorties et rester aligné avec la tendance dominante.
Utilisez-la comme outil de tendance autonome ou combinez-la avec votre stratégie existante pour une confirmation supplémentaire.
Visuels épurés. Signaux clairs. Trading de tendance confiant.
Résumé
Avis clients
5 | 0 % | |
4 | 100 % | |
3 | 0 % | |
2 | 0 % | |
1 | 0 % |


