
Description
Indicateur de Rupture de Volatilité - Moteur de Volatilité Hawkes
Cet indicateur est destiné à fournir un contexte, pas des actions de trading immédiates. La composante volatilité vous aide à savoir quand les conditions du marché changent - les périodes de faible volatilité précèdent souvent de grands mouvements, et les périodes de forte volatilité s'épuisent finalement. La composante EWMA vous maintient orienté avec la tendance en développement et met en évidence quand le prix s'écarte de celle-ci.
Combinez ces deux perspectives - régime de volatilité et contexte de tendance - avec votre propre méthodologie de trading et jugement. L'indicateur vous montre l'environnement - vous décidez quoi en faire.
Version 2.0
Ouvert aux mises à jour futures
-----------------------------------------------------------------------------------------------------------------------------------------------------------------------
Aperçu
-----------------------------------------------------------------------------------------------------------------------------------------------------------------------
Cet indicateur combine deux composants distincts pour aider les traders à identifier simultanément les régimes de volatilité et les conditions de tendance.
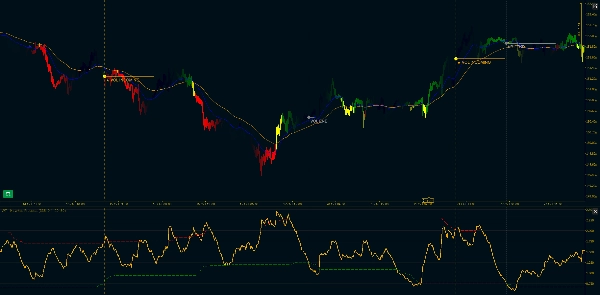
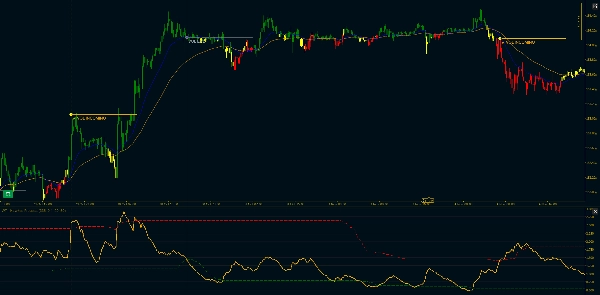
Le premier composant utilise un Processus de Hawkes pour détecter les changements de volatilité du marché. Contrairement aux indicateurs de volatilité traditionnels, il ne prédit pas la direction — il signale simplement quand le marché passe d'une compression calme à une volatilité active, ou inversement. Considérez-le comme un détecteur d'état de volatilité : il vous indique quand les choses s'intensifient ou se calment, mais pas dans quelle direction le prix va évoluer.
Le second composant ajoute un système double EWMA (Moyenne Mobile Exponentielle Pondérée) qui se superpose à votre graphique de prix. Cela vous donne un contexte de tendance utilisant un croisement de moyennes mobiles rapide et lente, avec une couche supplémentaire de coloration des chandeliers pour montrer quand le prix diverge de la tendance.
-----------------------------------------------------------------------------------------------------------------------------------------------------------------------
Comment ça fonctionne
-----------------------------------------------------------------------------------------------------------------------------------------------------------------------
Détection de la Volatilité : L'indicateur utilise l'estimateur de volatilité Parkinson High-Low — une méthode plus efficace que l'ATR standard car elle utilise la plage complète de la barre. Cette volatilité normalisée alimente un calcul du Processus de Hawkes, qui est ensuite comparé à des seuils dynamiques basés sur des quantiles.
Lorsque la volatilité dépasse le seuil supérieur après une période de compression, vous obtenez un signal "VOL INCOMING". Lorsqu'elle retombe sous le seuil inférieur, vous voyez "VOL END". Ce ne sont pas des signaux d'entrée — ce sont des changements de régime de volatilité. Le marché se réveille ou s'endort.
Contexte de Tendance : Deux moyennes mobiles exponentielles pondérées (rapide et lente) apparaissent sur votre graphique principal. La MA rapide est bleue, la MA lente est orange. Lorsque la rapide est au-dessus de la lente, la tendance est haussière. Lorsque la rapide est en dessous de la lente, la tendance est baissière.
Le Filtre de Divergence : Voici où ça devient intéressant. Parfois, le prix s'écarte significativement de la tendance. Lorsque la bougie entière (ouverture, haut, bas, clôture) est en dessous de la MA rapide pendant une tendance haussière, ou au-dessus pendant une tendance baissière, la barre devient jaune. C'est un filtre strict — si même la mèche touche la MA rapide, elle garde la couleur normale de la tendance.
Les barres jaunes apparaissent souvent lors des retracements ou des points d'épuisement, mais rappelez-vous : elles ne vous disent pas ce qui vient ensuite, juste que le prix s'est temporairement séparé de la ligne de tendance.
-----------------------------------------------------------------------------------------------------------------------------------------------------------------------
Caractéristiques Clés
-----------------------------------------------------------------------------------------------------------------------------------------------------------------------
Composante Volatilité :
- Normalisation de la volatilité Parkinson High-Low (plus efficace que la méthode ATR standard)
- Calcul du Processus de Hawkes avec décroissance ajustable (paramètre Kappa)
- Seuils dynamiques basés sur des quantiles (percentiles personnalisables)
- Marqueurs visuels : "VOL INCOMING" lors des ruptures de volatilité, "VOL END" lors des compressions
- Filtrage de continuation : seul le premier breakout est marqué, pas chaque pic
- Lignes de tendance horizontales optionnelles et marqueurs verticaux
Composante de Tendance EWMA :
- Calcul EWMA compatible Pandas (formule adjust=True)
- Lignes MA rapide et lente affichées sur le graphique principal des prix
- Longueurs de période personnalisables (par défaut : 20/50)
- Support des périodes minimales (supprime la sortie jusqu'à ce que suffisamment de données soient disponibles)
- Option Ignorer NA pour gérer les gaps
- Système de chandeliers à trois couleurs : Vert (tendance haussière), Rouge (tendance baissière), Jaune (divergence)
Options de Personnalisation :
- Période Parkinson (période de référence pour le calcul de la volatilité)
- Kappa Hawkes (taux de décroissance, affecte la sensibilité)
- Période de référence pour les quantiles
- Seuils de volatilité basse et haute (percentiles)
- Bascule d'annualisation et longueur de segment
- Périodes rapide et lente pour les moyennes mobiles
- Couleurs haussière, baissière et divergence
- Longueur d'extension des lignes de tendance
- Afficher/masquer les marqueurs verticaux
----------------------------------------------------------------------------------------------------------------------------------------------------------------------------
Note Technique : La composante Processus de Hawkes utilise un calcul exponentiel récursif optimisé pour une utilisation en temps réel. L'implémentation EWMA correspond au comportement de Pandas pour assurer la cohérence avec les backtests basés sur Python. Les deux composants calculent uniquement sur des barres fermées pour éviter le repainting.
Résumé
Avis clients
5 | 100 % | |
4 | 0 % | |
3 | 0 % | |
2 | 0 % | |
1 | 0 % |


![Logo de "[CB] Pivot Points Pro"](https://cdn.ctrader.com/image/webp/43463c82-67b0-4f10-a4ba-901bba091d81_32594)