
Описание
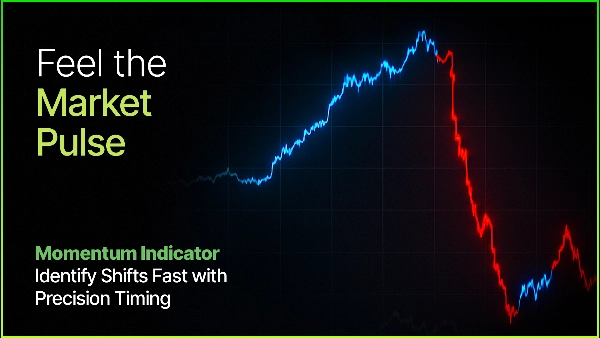
Amplitude Momentum Label — Адаптивное обнаружение тренда на основе волатильности
Amplitude Momentum Labeler объединяет несколько продвинутых концепций:
- Обнаружение режима — Определяет истинные фазы тренда
- Адаптация к волатильности — Автоматически подстраивается под текущие рыночные условия
- Динамический VWAP — Выделяет значимые уровни откатов и продолжения
- Оценка спреда Roll — Сигнализирует оптимальные точки повторного входа во время трендов
- МОДУЛЬ ОПТИМИЗАЦИИ — с функцией самооптимизации**
Это создает интеллектуальный, самонастраивающийся индикатор, который обеспечивает ясность, адаптивность и практические торговые зоны — без постоянной ручной настройки.
Что это такое?
Amplitude Momentum Labeler — это индикатор обнаружения режима, который определяет, когда рынок входит или выходит из фаз восходящего или нисходящего импульса — в реальном времени.
В отличие от традиционных пересечений скользящих средних, он измеряет фактические изменения импульса, оценивая смещение цены и силу разворота.
Основной вопрос
Находится ли рынок в данный момент в фазе импульса — и в каком направлении?
Для ответа на этот вопрос индикатор отслеживает:
- Амплитуду — насколько далеко сдвинулась цена;
- Последовательность — порядок, в котором происходят максимумы и минимумы.
Сильное движение, за которым следует значимый разворот, отмечает начало нового режима импульса.
Как это работает
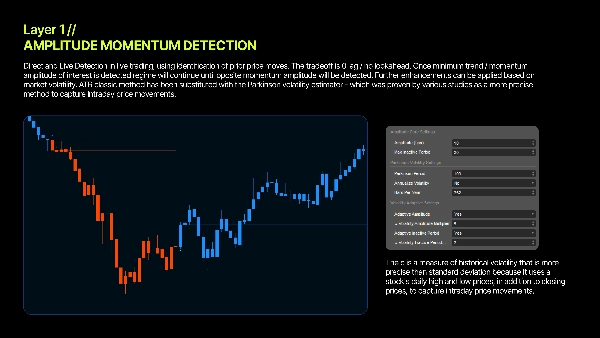
1. Измерение колебания
Индикатор постоянно обновляет максимальные и минимальные экстремумы цены.
Их разница — амплитуда — определяет текущий размер колебания рынка.
2. Обнаружение разворота
- Резкое падение, за которым следует сильный рост → **Восходящий импульс**
- Резкий рост, за которым следует сильное падение → **Нисходящий импульс**
3. Подтверждение значимости
Только развороты, превышающие порог, скорректированный на волатильность, вызывают действительный сигнал.
4. Обнаружение истощения
Если цена перестает двигаться, индикатор определяет истощение импульса и возвращается в нейтральное состояние.
Волатильность Паркинсона — адаптивные пороги
Большинство индикаторов используют фиксированные параметры. Этот адаптируется автоматически. Используя волатильность Паркинсона — которая учитывает внутридневные диапазоны максимумов и минимумов — индикатор регулирует чувствительность в зависимости от реальных рыночных условий. Результат: стабильная работа как в спокойной, так и в волатильной среде. (Статистически доказано более эффективен, чем метод ATR)
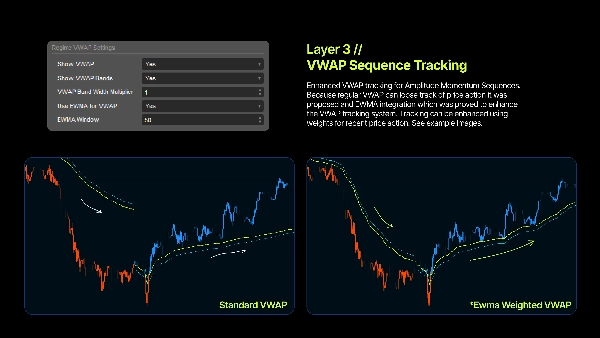
Режим VWAP — динамические уровни для повторного входа
После активации режима индикатор вычисляет VWAP, специфичный для этого тренда, обеспечивая динамические уровни поддержки и сопротивления. Институциональные игроки сильно полагаются на VWAP, и цена часто реагирует около него — что делает его идеальным для входов на откате.
Режим EWMA
Включите EWMA, чтобы придать больший вес недавним ценам, создавая более плавную и отзывчивую кривую VWAP. Отлично подходит для определения повторных входов во время продолжительных трендов.
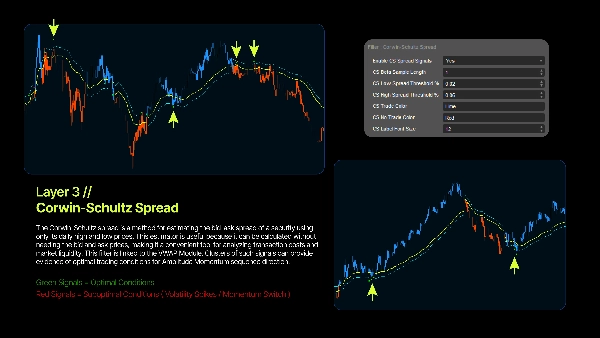
Оценка спреда Roll — динамический фильтр для повторного входа
Оценка спреда Roll — это метод оценки спреда бид-аск на основе наблюдаемых цен сделок, обычно с использованием серийной ковариации изменений цены. Разработанный Роллом, он предполагает, что последовательные сделки чередуются между ценами бид и аск, и что новая информация не постоянно изменяет "истинную" цену. Хотя метод прост и фундаментален, оригинальный метод был усовершенствован для устранения таких проблем, как смещение вниз и плохая производительность на некоторых наборах данных. Оценка основана на идее, что если новая информация не поступает, цены просто колеблются между бидом и аском. Предполагается равная вероятность сделок, инициированных покупкой и продажей.
Преимущества использования
1. Объективное определение тренда - Без трендовых линий. Без догадок. Математика определяет режим.
2. Адаптация к волатильности - Автоматически подстраивается под изменяющиеся условия с использованием волатильности Паркинсона.
3. Четкие зоны входа - Уровни VWAP режима помогают точно определить интуитивно понятные области откатов и добавлений.
4. Определенные границы режима - Точно знайте, когда начинается и заканчивается импульс.
5. Совместимость с несколькими таймфреймами - Нормализация в базисных пунктах обеспечивает стабильное поведение на любом графике.
Квантитативная основа
Логарифмические доходности
Использование логарифмических доходностей обеспечивает симметрию, делая измерение импульса математически надежным.
Базисные пункты
Все расчеты выполняются в стандартизированных единицах бп (1 бп = 0,01%), что обеспечивает согласованность между активами.
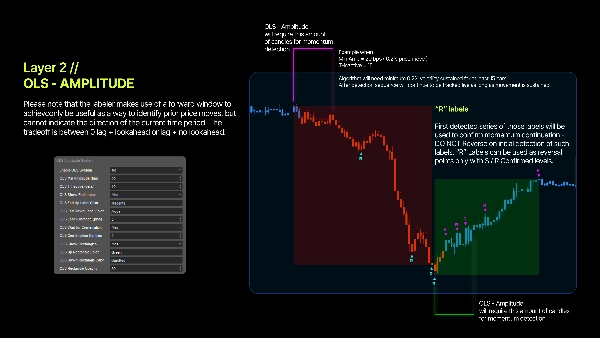
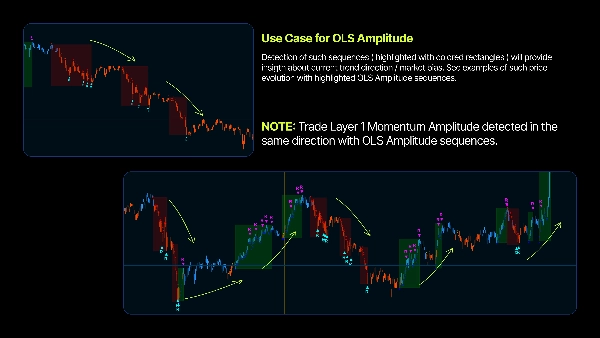
Обнаружение откатов
Сдвиги импульса выявляются через сильные направленные движения, за которыми следуют значимые контрдвижения (V-образные развороты).
Синтетический объем
Синтетический объем на основе диапазона и тела свечи обеспечивает точность VWAP для любого символа.
⎽⎽⎽⎽⎽⎽⎽⎽⎽⎽⎽⎽⎽⎽⎽⎽⎽⎽⎽⎽⎽⎽⎽⎽⎽⎽⎽⎽⎽⎽⎽⎽⎽⎽⎽⎽⎽⎽⎽⎽⎽⎽⎽⎽⎽⎽⎽⎽⎽⎽⎽⎽⎽⎽⎽⎽⎽⎽⎽⎽⎽⎽⎽⎽⎽⎽⎽⎽⎽⎽⎽⎽⎽⎽⎽⎽⎽⎽⎽⎽⎽⎽⎽⎽⎽⎽⎽⎽⎽⎽⎽⎽⎽⎽⎽⎽⎽⎽⎽⎽⎽⎽⎽⎽⎽⎽⎽⎽⎽⎽⎽⎽⎽⎽⎽
Этот инструмент предназначен только для образовательных и информационных целей. Это не инвестиционный совет. Торговля связана с риском, и убытки могут превышать депозиты. Прошлые результаты не гарантируют будущих. Вы несете полную ответственность за все торговые решения. Создатель не несет ответственности за финансовые потери, возникшие в результате использования индикатора. Всегда проводите собственный анализ перед торговлей.
Сводка
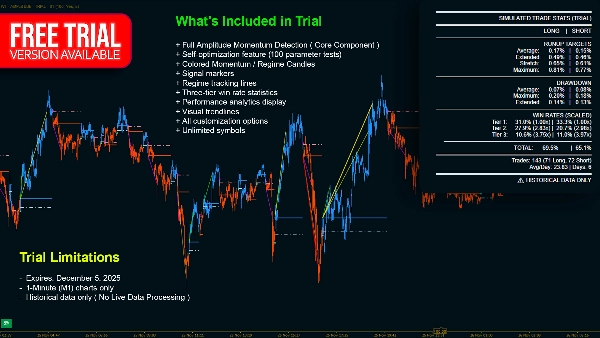
Key features include:
- **Regime Detection:** Pinpoints market entry and exit points for momentum trends.
- **Volatility Adaptation:** Uses Parkinson Volatility to self-tune sensitivity based on current market conditions, ensuring consistent performance across varying volatility.
- **Dynamic VWAP:** Calculates a volume-weighted average price specific to each trend regime, providing dynamic support and resistance levels for pullback and continuation entries.
- **Roll Spread Estimator:** Estimates bid-ask spreads to signal optimal re-entry points during trends.
- **Self-Optimization Module:** Automatically adjusts parameters without manual intervention.
The indicator operates by continuously tracking price extremes to measure swing amplitude, detecting significant reversals that exceed volatility-adjusted thresholds, and identifying momentum exhaustion when price progression stalls. It uses logarithmic returns and basis-point normalization for mathematically robust, cross-asset consistency. Synthetic volume calculations enhance VWAP accuracy across symbols.
This tool supports multiple markets including Forex, stocks, indices, commodities, and cryptocurrencies, and is compatible with various timeframes. It outputs visual signals and filters to assist traders in objective trend identification and clear entry zone determination.
Отзывы покупателей
5 | 75 % | |
4 | 25 % | |
3 | 0 % | |
2 | 0 % | |
1 | 0 % |


