
Deskripsi
Indikator mengamati aliran tick langsung dan, untuk setiap kerangka waktu yang Anda aktifkan (dari 5 detik hingga 20 menit), menjaga jendela bergulir aktivitas terbaru. Dalam setiap jendela, ia membandingkan dua hal: ke arah mana harga bergerak, dan ke arah mana aliran order condong (perkiraan tekanan beli/jual yang dibangun kembali dari pergerakan tick, karena cTrader tidak mempublikasikan volume nyata). Ketika harga dan aliran menunjuk ke arah yang sama, kerangka waktu membaca OK. Ketika mereka tidak setuju, itu menandai sebuah divergen — BULL saat harga turun tetapi aliran membeli, BEAR saat harga naik tetapi aliran menjual — dan menghitung berapa lama ketidaksepakatan itu berlangsung. Semua ini ditampilkan melalui panel yang dapat dipindahkan di grafik (bacaan per kerangka waktu plus garis putusan gabungan dan meter tekanan beli/jual opsional), pewarnaan batang opsional yang mewarnai lilin berdasarkan arah yang dominan, histogram di sub-pane, penanda saat arah dominan berubah, level referensi opsional yang memudahkan melihat divergensi harga-vs-histogram, dan peringatan suara opsional yang memberikan petunjuk audio tanpa harus menonton layar.
Perkiraan aliran (dasar)
cTrader tidak menampilkan volume beli/jual nyata, jadi indikator memperkirakan aliran dari pergerakan harga itu sendiri: setiap kenaikan dihitung sebagai pembelian, setiap penurunan sebagai penjualan, dan tick tanpa perubahan harga baik mempertahankan kecenderungan sebelumnya atau dihitung sebagai netral (pilihan Anda — lihat Flat Tick Carry). Untuk menghindari gangguan dari fluktuasi spread bid/ask, harga dibaca sebagai mid-price (titik tengah antara bid dan ask).
Setiap tick diproses sekali dan disimpan dalam pool bersama yang dibaca oleh semua kerangka waktu, sehingga tidak ada duplikasi dan memori tetap kecil meskipun semua kerangka waktu diaktifkan. Setiap kerangka waktu hanya melihat irisan pool tersebut di dalam jendelanya sendiri.
Untuk setiap jendela, indikator melacak:
- Pergerakan harga — seberapa jauh harga bergerak selama jendela, dilaporkan dalam tick (increment harga terkecil instrumen).
- Aliran (delta) — kecenderungan beli-kurang-jual bersih selama jendela yang sama.
Kerangka waktu
Ada satu baris untuk setiap kerangka waktu yang Anda aktifkan, selalu diurutkan dari yang terpendek ke terpanjang: 5s, 15s, 30s, 1m, 5m, 10m, 20m. Urutan itu juga adalah urutan baris panel, dan menentukan seberapa besar bobot setiap kerangka waktu dalam pewarnaan batang — kerangka waktu yang lebih lambat dihitung lebih banyak.
Saat indikator dimuat, ia memanaskan setiap kerangka waktu dengan memutar ulang riwayat terbaru melalui jalur yang sama persis yang dilalui tick langsung, sehingga setiap baris langsung bermakna dan tidak mulai kosong lalu terisi seiring waktu nyata (lihat Preload History dan Max History Bars).
Panel
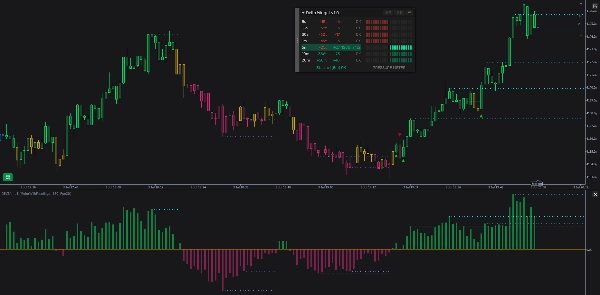
Panel yang dapat dipindahkan duduk di grafik Anda. Ia memiliki bar judul dengan tiga tombol, badan yang dapat menampilkan tabel bacaan, meter tekanan, atau keduanya, dan garis putusan gabungan.
Tabel bacaan
Satu baris per kerangka waktu, dengan empat kolom:
- TF — label kerangka waktu (5s, 15s, …20m).
- Harga — pergerakan harga selama jendela dalam tick, dengan tanda (misalnya
+350tatau-650t). Hijau saat naik, merah saat turun. - Delta — kecenderungan aliran sebagai angka bertanda (misalnya
+16atau-12). Hijau saat pembelian memimpin, merah saat penjualan memimpin. Nilai besar dipersingkat dengank(misalnya+1,2k). - Status —
OKsaat harga dan aliran setuju, atau panah plus durasi saat kerangka waktu mengalami divergensi:↗ 2m 15suntuk divergensi BULL,↘ 45suntuk divergensi BEAR. Seluruh baris diberi warna hijau pudar (BULL) atau merah pudar (BEAR) selama divergensi aktif.
Meter tekanan
Tampilan alternatif (atau tambahan) yang mengubah setiap baris kerangka waktu menjadi grafik batang kiri/kanan dari tekanan beli/jual. Dari garis tengah yang tipis, tekanan jual menyalakan sel ke kiri dan tekanan beli menyalakan sel ke kanan. Berapa banyak sel yang menyala mencerminkan seberapa penuh kerangka waktu itu relatif terhadap normal terbarunya sendiri, jadi kerangka waktu cepat dan lambat masing-masing ditampilkan terhadap garis dasar mereka sendiri, bukan satu sama lain. Sel yang menyala menyala lebih terang saat kerangka waktu itu mengalami divergensi BULL atau BEAR yang nyata. Judul "PRESSURE METER" dan garis putusan sendiri berada di bawahnya.
Dalam tata letak keduanya, meter dan tabel bacaan muncul berdampingan dan berbagi satu garis putusan.
Pewarnaan batang (regime)
Opsional, indikator mewarnai lilin harga Anda berdasarkan arah yang dominan — regime — yang merupakan bacaan yang lebih stabil dibandingkan kerangka waktu tunggal mana pun. Bisa berupa Bull, Bear, atau Conflict, dan dipertahankan dengan kekakuan bawaan sehingga tetap pada tempatnya di seluruh batang dan hanya berubah saat kecenderungan jelas bergeser (ini menghindari perubahan terus-menerus).
Apa yang membangun regime. Setiap kerangka waktu yang diaktifkan "memilih" setiap batang berdasarkan arah harganya, dan suara tersebut digabungkan menjadi satu angka berjalan. Kerangka waktu yang lebih lambat dan pergerakan yang lebih besar dihitung lebih banyak. Angka gabungan itu kemudian dihaluskan selama batang-batang terbaru. Hasil yang dihaluskan itulah yang menggerakkan warna batang dan histogram di §6, sehingga keduanya tidak pernah bertentangan.
Histogram
Suara yang sama yang dihaluskan dan mewarnai batang juga digambar sebagai histogram di panel indikator sendiri di bawah harga: batang hijau di atas tengah saat kecenderungan bersih bullish, batang merah di bawah saat bearish, satu batang per lilin tertutup (batang saat ini diperbarui secara langsung). Batang yang lebih tinggi berarti kecenderungan yang lebih kuat. Karena angka yang sama persis berada di balik pewarnaan batang, histogram dan warna lilin selalu setuju. Ini berguna sendiri untuk mendeteksi momentum yang memudar — misalnya harga mendorong ke titik tertinggi baru sementara puncak histogram semakin pendek.
Level referensi
Opsional, indikator menggambar garis referensi horizontal datar yang menyoroti puncak dan lembah histogram pada kedua panel sekaligus: garis di sub-pane berada di ekstrem histogram, dan garis yang cocok di grafik harga berada di titik tertinggi (untuk ekstrem atas) atau terendah (untuk ekstrem bawah) batang yang sama. Menempatkan referensi yang sama di kedua panel membuat divergensi mudah terlihat — misalnya harga mencetak titik tertinggi baru sementara garis yang cocok di histogram menunjukkan gagal mencapai itu.
Peringatan suara
Indikator dapat memberikan petunjuk audio sehingga Anda tidak perlu menonton panel. Ada dua sumber peringatan independen, dan keduanya hanya berfungsi saat panel menampilkan meter tekanan (baik tata letak meter saja atau berdampingan) — peringatan dibangun di sekitar bacaan meter. Setiap sumber juga memiliki tombol hidup/mati sendiri, dan cooldown bersama mencegah pasar yang fluktuatif mengirimkan suara berulang-ulang.
Pemanasan & konsistensi
Dengan Preload History aktif, indikator membangun kembali riwayat terbaru saat dimuat — pewarnaan batang, histogram, penanda, dan level referensi langsung muncul alih-alih hanya terbentuk ke depan. Max History Bars menentukan seberapa jauh rekonstruksi itu berjalan (semakin jauh memberikan konteks lebih tetapi memuat lebih lambat).
Riwayat yang dibangun kembali dibuat untuk cocok dengan apa yang akan dihasilkan sesi langsung.
Bagaimana bagian-bagian saling melengkapi
- Perkiraan aliran dan kerangka waktu adalah dasar — semua yang lain membaca dari mereka.
- Tabel bacaan, meter tekanan, dan garis putusan
- Pewarnaan batang dan histogram berbagi satu bacaan arah yang dihaluskan, jadi mereka selalu setuju.
- Penanda muncul saat arah itu berubah, pada penutupan lilin.
- Level referensi menandai puncak dan lembah histogram di kedua panel.
- Peringatan suara menyuarakan meter tekanan dan putusan gabungan, sehingga Anda bisa menjauh dari layar.
Ringkasan
The indicator features a draggable on-chart panel displaying a readings table per timeframe, a combined verdict line, and an optional buy/sell pressure meter. It offers bar coloring that tints price candles by prevailing directional regime (Bull, Bear, or Conflict), a histogram reflecting smoothed directional votes, markers indicating direction changes, and optional reference levels highlighting histogram extremes to aid divergence detection. Sound alerts provide audio cues based on pressure meter readings.
The indicator preloads recent history to present immediate, consistent data upon loading. It supports visualization, signals for divergences, breakouts, reversals, trend strength, volatility regimes, and level touches or breaks, requiring tick data input.


















![Logo "Wyckoff Toolkit [Iridio Capital]"](https://cdn.ctrader.com/image/webp/5318c788-91ef-4297-bca6-4ce73b1516a8_61556)

