
Description
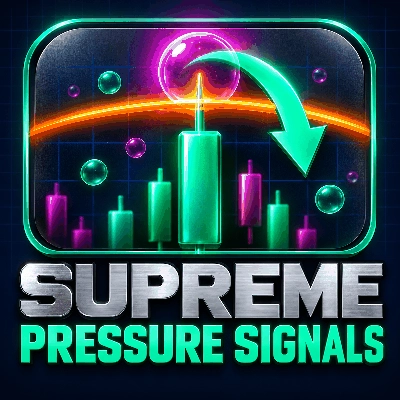
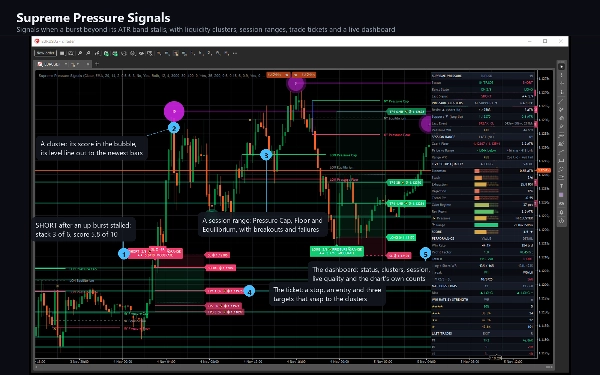
Supreme Pressure Signals looks for one event: a burst that runs out of fuel. A bar's high or low travels far beyond a volatility band around its average, the next bar stops expanding, and the indicator marks a signal against the burst, back toward the average. Around that core it maps liquidity clusters at swing points, tracks timed session ranges, rates every signal from 0 to 10 with up to four stars, and draws a ticket with an entry, a stop and three targets.
WHAT IT DRAWS
- LONG and SHORT labels on the signal bars, with the burst's stack height, the stars and the score. Hover a label to read what went into it.
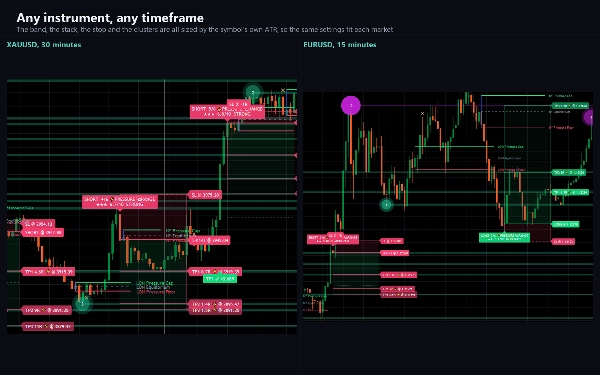
- Pressure clusters: bubbles sized by strength with a 0 to 10 score inside, and a level line out to the newest bars. Support clusters sit under price at swing lows, resistance clusters above it at swing highs.
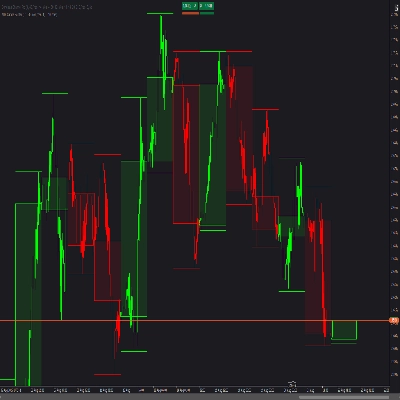
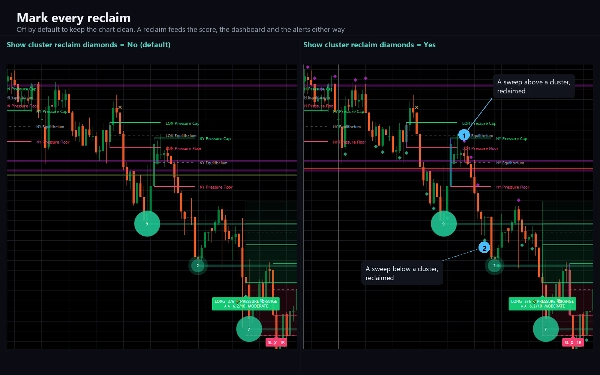
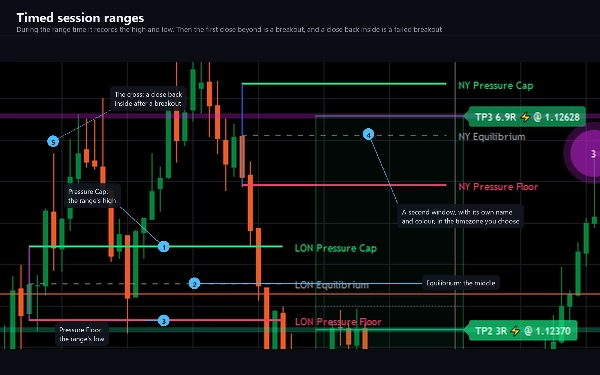
- Session ranges: a box for each opening range, with Pressure Cap, Pressure Floor and Equilibrium lines that carry the window's name, and a cross where a breakout fails back inside. Optional diamonds mark a sweep that was reclaimed.
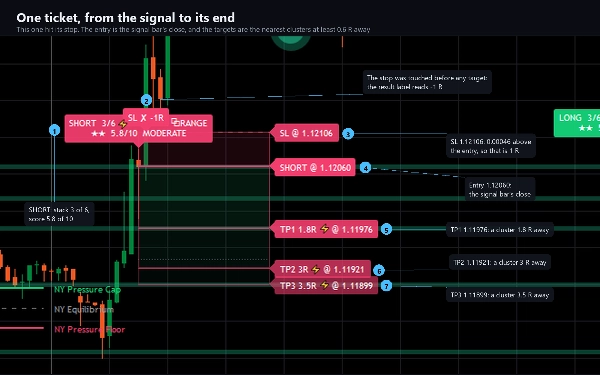
- The trade ticket: a stop zone and three target zones, lines and priced labels, and a result label when the trade ends, such as TP3 with its R, SL or TIME.
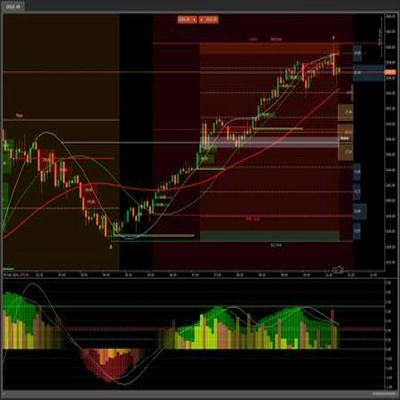
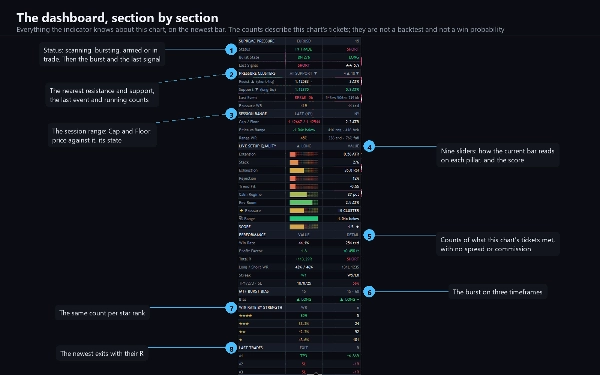
- A dashboard in any of six positions: status, the burst state, the last signal, the nearest clusters and the last cluster event, the session range, the nine live quality sliders with the score, a burst bias on three timeframes, the last trades, and a section that counts what the chart's tickets met.
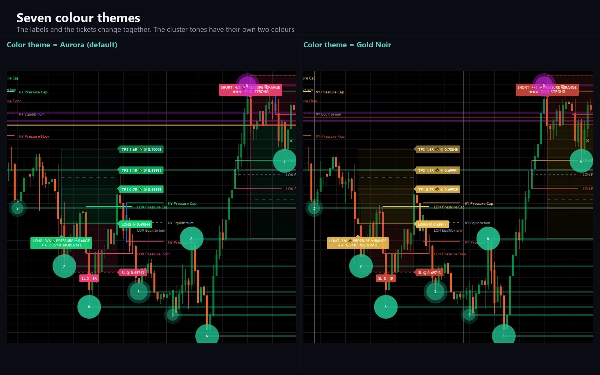
- Seven colour themes and an optional tint on extreme bursts.
HOW IT DECIDES
The burst. The band sits 2 ATR on each side of a 20-bar EMA. A bar bursts when its high or low pokes through. The distance beyond the band builds a stack of up to six levels, one for every half ATR.
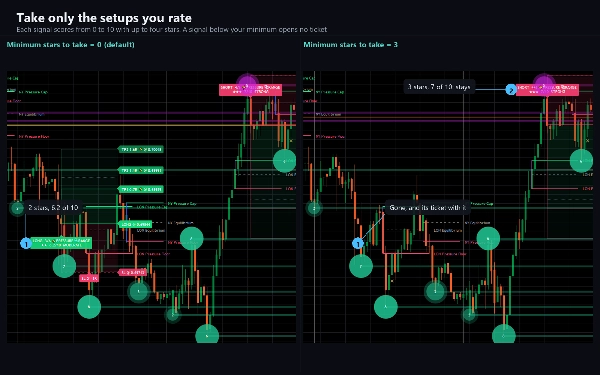
The signal. When a bursting bar is followed by one that reaches less far, the burst has peaked. If that peak reached level 3 or higher, the indicator signals when the bar closes: short after an up burst, long after a down burst. It needs no open trade and 20 bars since the last signal. Optional filters ask for a minimum distance beyond the band, a rejection wick, RSI exhaustion, a cluster touch, a burst beyond the session range, a live trading session, a minimum star rank, or one direction only. With the default bar-close setting a signal does not change after it prints.
The clusters. Every swing high and low with 12 bars on its left and 4 on its right can start a cluster, weighted by the volume and size of the bars around it. Price reaching into a cluster's band is a touch. Going through it by a minimum depth is a sweep. Closing back within six bars is a reclaim. Staying beyond it is a break, and the cluster then flips to the other side. A cluster's score combines its weight, how well it has held and how recently it was tested. Clusters are built over the last 3,000 bars when the indicator loads.
The session ranges. Two windows are on by default and a third is ready to switch on, each with a range time, a session time and a name, in the timezone you choose. When the range time ends, a close beyond it in that session is a breakout, and a close back inside is a failed breakout. The module switches itself off on daily charts and above.
The score. Nine pillars, with weights you can change: burst extension, stack height, momentum exhaustion, rejection wick, trend fit, volatility regime, reversion room, pressure cluster and session range. One star starts at 4.5, four stars at 7.5. It describes the setup; it is not a forecast.
The ticket. The entry is the close of the signal bar. The stop sits beyond the burst's extreme with a small ATR buffer, kept between 0.5 and 3 ATR. A fixed ATR multiple or the swing extreme are the other choices. By default the targets are the nearest opposing clusters at least 0.6 R away, and a rung with no cluster falls back to its R multiple. Plain R multiples and a move back to the average are the other two choices. These levels are planning references, not orders.
How a trade ends. Reaching the third target ends it. Touching the stop before any target ends it at -1 R. Touching the stop after a target was reached ends it at that target's R. A stop bar that also touches a target counts as a full stop. A trade still open after 200 bars ends at that bar's close, as a time stop.
KEY SETTINGS
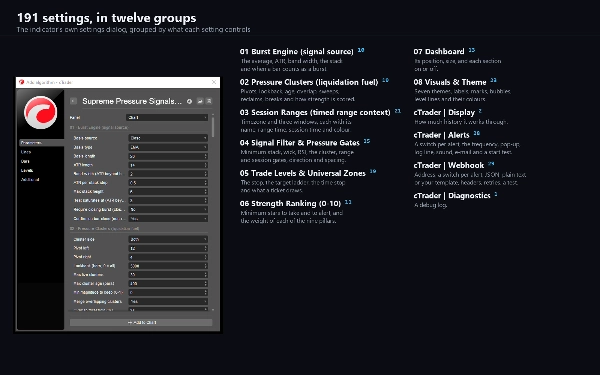
191 settings in twelve groups. Eight come first: the burst engine, pressure clusters, session ranges, the signal filter, trade levels, strength ranking, the dashboard and the visuals. Four more belong to this platform: display, alerts, the webhook and diagnostics. One of them sets how much history it works through (20,000 bars by default).
ALERTS AND WEBHOOK
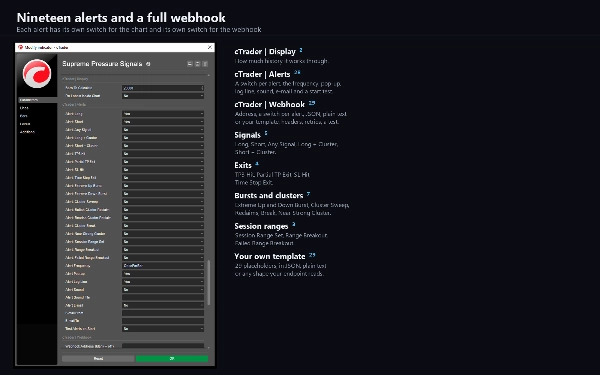
Nineteen conditions, each with its own switch: Long, Short, Any Signal, Long + Cluster, Short + Cluster, TP3 Hit, Partial TP Exit, SL Hit, Time Stop Exit, Extreme Up Burst, Extreme Down Burst, Cluster Sweep, Bullish Cluster Reclaim, Bearish Cluster Reclaim, Cluster Break, Near Strong Cluster, Session Range Set, Range Breakout and Failed Range Breakout. Each can arrive as a pop-up, a log line, a sound of your choice and e-mail, and a test on start checks your settings without waiting for a signal. One setting chooses once per bar, once per bar close, only once or once per minute. Signals and the time stop alert when the bar closes. Stops, targets and cluster events alert on the touch. Nothing fires while the indicator walks the chart's history, and nothing fires in a backtest.
A webhook posts the same nineteen to any address you enter: a chat bot, a journal, an automation flow or your own server. Choose JSON with the trade's fields, plain text or your own template with 29 placeholders. Add an access key header and one more header of your own. A post that gets no success answer is sent again, and a test on start checks the address. It stays off until you enter one, is capped at twenty messages a minute, and a failure is logged rather than thrown. It sends through cTrader's own networking service, which is why the indicator needs no file or network access rights at all.
TYPE AND WINDOW
An indicator on the main price chart. It draws nothing in a pane of its own.
TIMEFRAMES AND INSTRUMENTS
Any timeframe from one minute up, and any instrument: forex pairs, metals, indices and crypto. The band, the stack, the stop and the clusters are all sized by the symbol's own ATR, so the same settings fit each market. Session ranges need an intraday chart. When it attaches, the indicator loads the history it needs, up to the history setting.
USE CASES
- Waiting for an over-extended move to stall instead of chasing it.
- Seeing where swing-point liquidity sits and whether a burst reached it, swept it or was rejected by it.
- Reading an opening range with its breakouts and failed breakouts.
- Planning a trade from levels that follow the chart's clusters and volatility.
- Being told when a signal fires, a cluster is swept or a trade ends.
WHO IT IS FOR
Traders who fade over-extended moves and want the reason for every signal in view.
TECHNICAL NOTES AND LIMITATIONS
Access rights: none. The indicator cannot read files, start processes or open connections of its own.
It is a charting and analysis tool. It does not place orders and it has no access to your account.
The dashboard's counts describe the tickets drawn on the bars your chart has loaded. They take no account of spread, slippage or commission, they are not a backtest and they are not a win probability. On a deep chart the older tickets were drawn before the cluster window starts, so they ran without clusters.
Cluster weights read your broker's tick volume, and everything reads your broker's candles, so another feed can draw differently. A symbol with no volume still runs. The trade state depends on where history starts, so a different history setting can change the earliest signals. On the bar that is still forming, the dashboard moves with every tick and a touch can change until the bar closes.
SUPPORT
Questions go through the Discussion tab. Include your broker, symbol, timeframe, cTrader version and a picture of the full chart, and you will get a useful answer first time.
Trading involves risk. Past performance does not guarantee future results.
Summary
Key features include mapping liquidity clusters at swing highs and lows, tracking intraday session ranges with breakout and failed breakout detection, and displaying a trade ticket outlining entry, stop-loss, and three target levels based on cluster proximity and ATR multiples. The indicator offers extensive customization with 191 settings covering burst detection, cluster analysis, session ranges, signal filtering, trade planning, and visual themes.
A dashboard provides real-time status, burst states, cluster events, session information, signal quality scores, and trade outcomes. Alerts and webhook notifications cover nineteen conditions such as signal generation, cluster events, trade exits, and session range changes, supporting multiple delivery methods and customizable message formats.
Supreme Pressure Signals is intended for traders who aim to fade over-extended moves by understanding the context and quality of each signal. It operates as a charting and analysis tool without order execution or account access.