
Deskripsi
Woodie_CCI_pro adalah toolkit canggih berbasis CCI yang dibangun di sekitar metodologi klasik Woodie CCI.
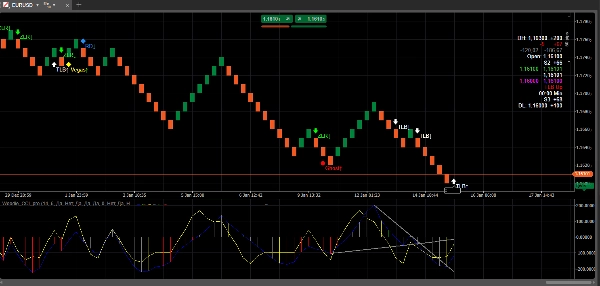
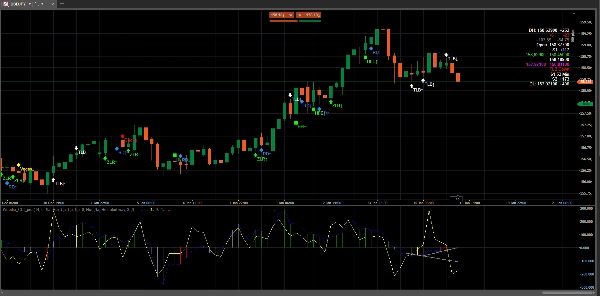
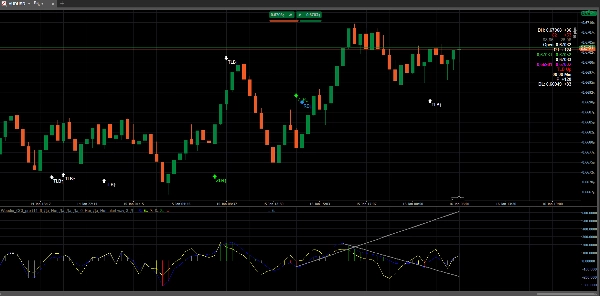
Ini memplot CCI gaya Woodie dengan pelunakan dan menyoroti pola Woodie paling penting dengan sinyal jelas di grafik, penanda osilator opsional, dan panduan garis tren TLB opsional di dalam panel CCI untuk konteks yang lebih baik dan pengambilan keputusan yang lebih cepat.
Dirancang untuk visibilitas historis yang bersih: semua sinyal digambar pada sejarah, label menunjukkan nama pola yang tepat, dan rendering garis tren dioptimalkan untuk menghindari distorsi skala dan “artefak garis”.
Fitur Utama
1) Deteksi Pola Woodie (Sinyal Otomatis)
Woodie_CCI_pro mendeteksi dan memberi label pola Woodie berikut:
- ZLR (Zero Line Reject)
- Ghost
- HFE (Hook From Extreme)
- TLB (Trend Line Break)
- HTLB (Horizontal Trend Line Break)
- RD (Reverse Divergence)
- Famir
- Vegas Trade (VT)
Setiap sinyal digambar dengan penanda yang sadar arah (Naik/Turun) dan label (misalnya, ZLR↑, TLB↓) sehingga Anda selalu tahu dengan tepat apa yang terjadi.
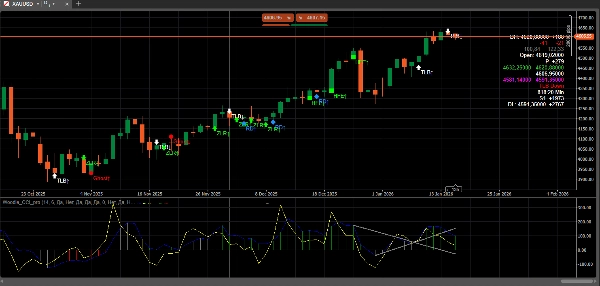
2) Sinyal Langsung di Grafik Harga
Sinyal ditampilkan pada grafik harga sebagai panah/ikon dengan label teks untuk kejelasan maksimum saat meninjau sejarah dan pengaturan langsung.
Opsi termasuk:
- tampilkan/sembunyikan sinyal di grafik
- tampilkan/sembunyikan label
- format label kompak (contoh:
RD↑) - offset label/penanda dalam pips untuk penempatan yang bersih
3) Penanda Osilator Opsional
Jika Anda lebih suka nuansa klasik Woodie, Anda dapat mengaktifkan penanda sinyal opsional di dalam panel CCI (titik/titik kecil).
Ini sepenuhnya opsional sehingga osilator tetap bersih ketika Anda hanya menginginkan sinyal tingkat grafik.
4) Panduan Garis Tren TLB di Panel CCI (Tanpa Masalah Skala)
Untuk pengenalan struktur yang lebih baik, indikator dapat menggambar garis tren TLB di dalam panel CCI:
- Garis TLB Saat Ini (panduan ayunan-ke-ayunan terbaru)
- Opsi Keep On Signal untuk mempertahankan garis tren yang digunakan pada saat breakout untuk tinjauan kemudian
Rendering dirancang agar tetap bersih pada sejarah dan menghindari artefak “tepi” atau penskalaan paksa.
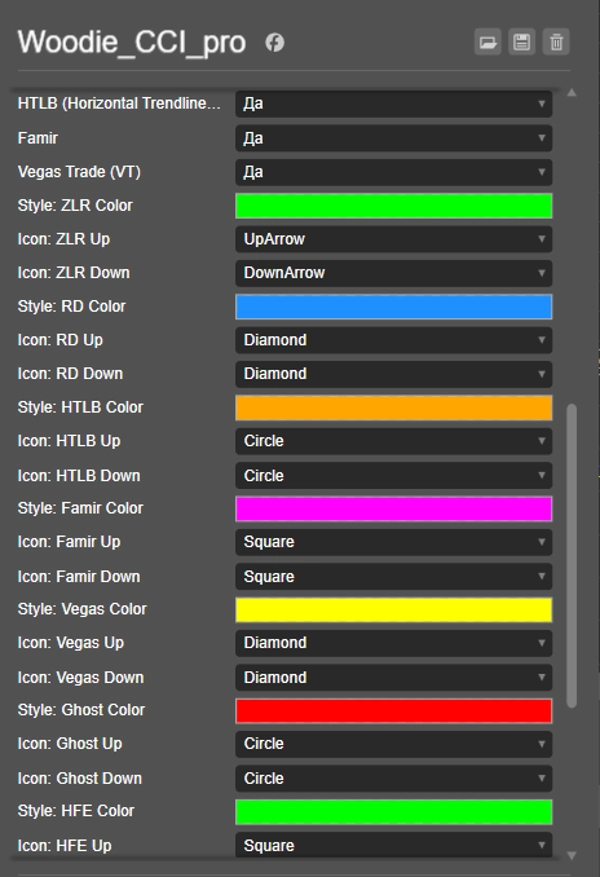
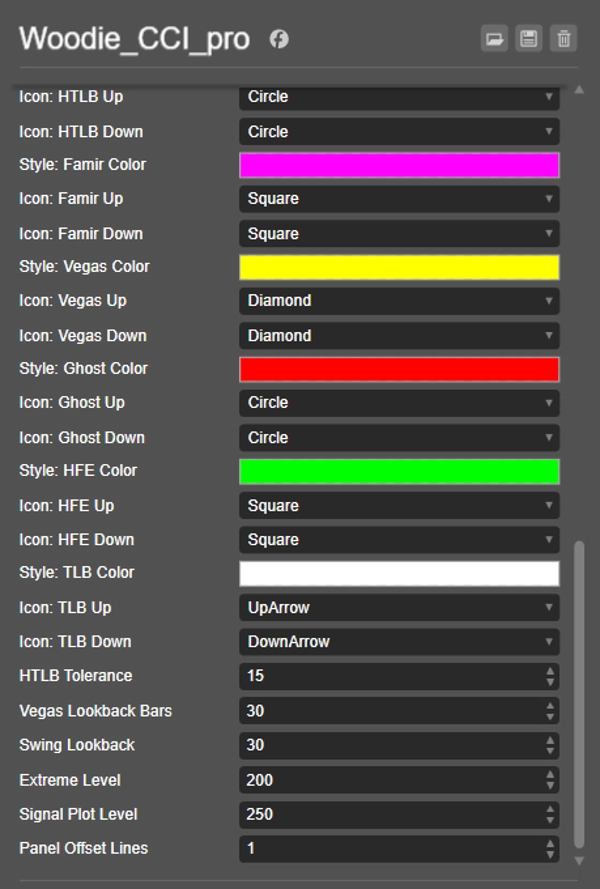
5) Kontrol Gaya & Visualisasi (Per Pola)
Anda dapat menyesuaikan tampilan visual per pola:
- jenis ikon untuk Naik/Turun
- warna per pola (jika didukung)
- label kompak vs penuh
6) Peringatan (Opsional)
Aktifkan peringatan untuk sinyal yang dipilih:
- pesan popup gaya di grafik
- notifikasi suara opsional (jika didukung oleh pengaturan platform Anda)
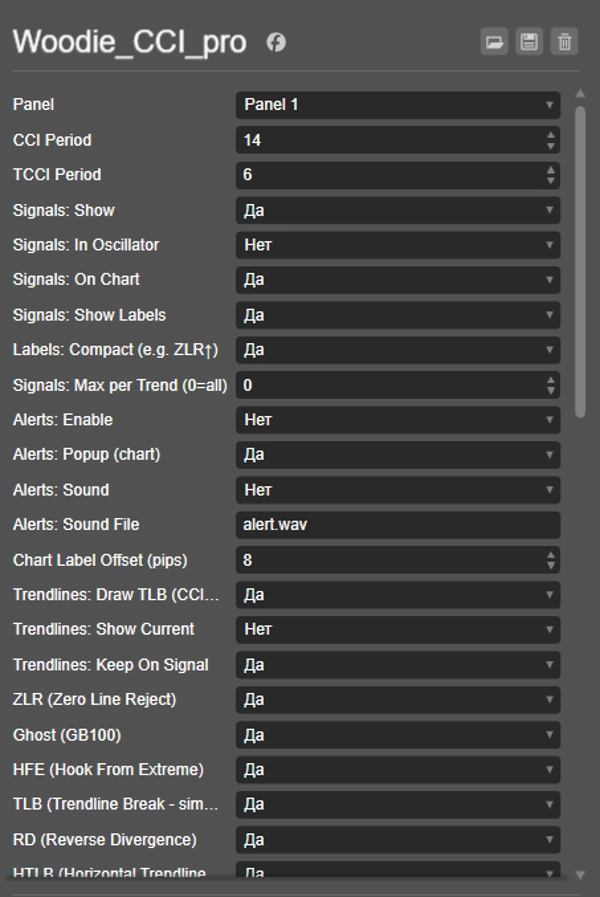
7) Filter “Max Signals Per Trend” (Opsional)
Untuk mengurangi kebisingan, Anda dapat membatasi sinyal per tren:
Maks per Tren (0 = tanpa batas)- menghitung hanya sinyal yang selaras dengan tren saat ini (berdasarkan tanda TCCI)
Alur Kerja Tipikal
- Tambahkan Woodie_CCI_pro ke grafik.
- Aktifkan Sinyal di Grafik dan Label untuk mempelajari perilaku pola dengan cepat pada sejarah.
- Nyalakan garis tren TLB jika Anda menginginkan konteks struktural untuk perdagangan breakout dan kelanjutan.
- Opsional aktifkan Penanda Osilator jika Anda lebih suka konfirmasi titik klasik Woodie.
Catatan & Filosofi
- Indikator ini bertujuan untuk menjadi praktis dan mudah dibaca daripada “terlalu disesuaikan”.
- Beberapa pola (terutama yang berbasis garis seperti TLB/HTLB/RD/Vegas) mencakup toleransi/lookback yang dapat disesuaikan karena struktur pasar berbeda di antara simbol/timeframe.
- Output visual dioptimalkan untuk sejarah yang bersih, penskalaan stabil, dan kekacauan minimal.
Ringkasan
Ulasan pelanggan
5 | 50 % | |
4 | 50 % | |
3 | 0 % | |
2 | 0 % | |
1 | 0 % |


