
Deskripsi
The Wyckoff Schematic Indicator adalah alat struktur pasar kelas profesional yang dirancang untuk secara otomatis mendeteksi dan memvisualisasikan fase akumulasi dan distribusi Wyckoff langsung pada grafik.
Dibangun berdasarkan prinsip Metode Wyckoff, indikator ini mengidentifikasi peristiwa institusional utama seperti Selling Climax (SC), Automatic Rally (AR), Spring, Sign of Strength (SOS), Buying Climax (BC), Upthrust (UTAD) dan lainnya—membantu trader memahami perilaku smart money secara real time.
Berbeda dengan indikator tradisional, alat ini tidak bergantung pada sinyal yang tertinggal tetapi fokus pada struktur harga, perilaku volume, dan volatilitas, memberikan wawasan yang lebih dalam tentang dinamika pasar.
Konsep Inti
Indikator ini didasarkan pada gagasan bahwa pasar bergerak melalui siklus terstruktur:
- Akumulasi → Markup → Distribusi → Markdown
Ini secara otomatis mendeteksi dan memvisualisasikan:
- Rentang pasar
- Fase Wyckoff (A–E)
- Peristiwa institusional utama
- Breakout dan fakeout struktural
Fitur Utama
1. Deteksi Fase Wyckoff Otomatis
Indikator mengidentifikasi semua fase utama siklus Wyckoff:
- Fase A – Menghentikan tren
- Fase B – Membangun sebab (pembentukan rentang)
- Fase C – Spring / UTAD (breakout palsu)
- Fase D – Konfirmasi tren (SOS / SOW)
- Fase E – Kelanjutan tren
Setiap fase disorot secara visual dengan warna yang dapat disesuaikan untuk pengenalan instan.
2. Pengakuan Peristiwa Cerdas
Sistem mendeteksi peristiwa Wyckoff kritis:
Akumulasi:
- SC – Selling Climax
- AR – Automatic Rally
- ST – Secondary Test
- Spring – False breakdown
- SOS – Sign of Strength
- LPS – Last Point of Support
Distribusi:
- BC – Buying Climax
- AR – Automatic Reaction
- ST – Secondary Test
- UTAD – Upthrust After Distribution
- SOW – Sign of Weakness
- LPSY – Last Point of Supply
Peristiwa ini diplot langsung pada grafik dengan label.
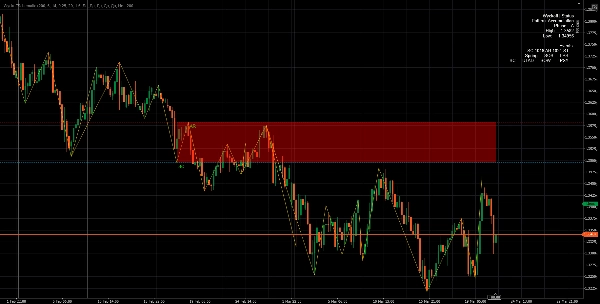
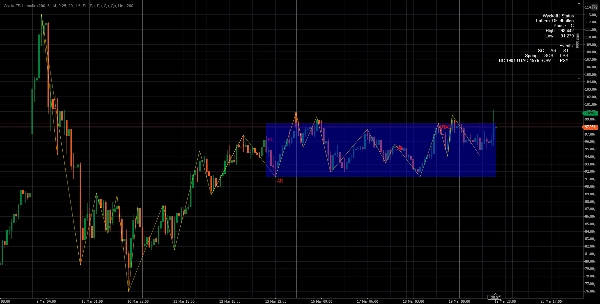
3. Deteksi Rentang Adaptif
Indikator secara dinamis membangun dan memperbarui rentang perdagangan:
- Secara otomatis mendeteksi tinggi dan rendah rentang
- Menyesuaikan batas menggunakan toleransi berbasis ATR
- Menampilkan zona support dan resistance
Ini memungkinkan trader melihat dengan jelas di mana pasar sedang mengakumulasi atau mendistribusikan.
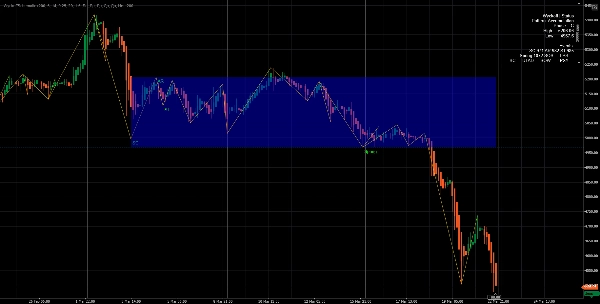
4. Mesin Struktur ZigZag
Sebuah sistem ZigZag berbasis pivot bawaan:
- Menyaring noise pasar
- Menyoroti tinggi dan rendah struktural yang sebenarnya
- Memastikan pengenalan pola yang akurat
Ini penting untuk mengidentifikasi struktur Wyckoff secara andal.
5. Integrasi Volume & Volatilitas
Indikator menggunakan:
- Rata-rata Bergerak Volume
- Deteksi Lonjakan Volume
- ATR (Average True Range)
Ini memungkinkan untuk:
- Mengonfirmasi aktivitas institusional
- Menyaring sinyal palsu
- Meningkatkan akurasi peristiwa seperti SC, BC, Spring, UTAD
6. Logika Mesin Status Real-Time
Pada intinya, indikator menjalankan algoritma mesin status yang:
- Melacak evolusi struktur pasar
- Bertransisi antar fase (A → E)
- Mencegah sinyal duplikat
- Mempertahankan konteks (Akumulasi vs Distribusi)
7. Komponen Visual
Indikator menyediakan seperangkat alat visual lengkap:
- ✔ Kotak sorot fase
- ✔ Garis tinggi/rendah rentang
- ✔ Garis struktur ZigZag
- ✔ Label peristiwa pada grafik
- ✔ Panel status real-time
8. Panel Status (Wawasan Pasar Langsung)
Panel bawaan menampilkan:
- Pola saat ini (Akumulasi / Distribusi)
- Fase saat ini (A–E)
- Batas rentang
- Peristiwa yang terdeteksi
Ini memberikan trader gambaran instan tentang kondisi pasar.
9. Sistem Peringatan
Opsional peringatan popup memberi tahu Anda saat peristiwa kunci terjadi:
- SC, BC, Spring, UTAD, SOS, SOW, dll.
Sempurna untuk memantau banyak pasar.
Keunggulan
✔ Perspektif Smart Money
Berbeda dengan indikator umum, alat ini mengikuti logika institusional, bukan indikator ritel.
✔ Deteksi Sinyal Dini
Mengidentifikasi akumulasi/distribusi sebelum breakout, memungkinkan:
- Entri awal
- Setup risiko/imbalan yang lebih baik
✔ Pengurangan Noise
Menggunakan pivot, ATR, dan filter volume, indikator menghindari:
- Sinyal acak
- Noise pasar
- Breakout palsu
✔ Analisis Wyckoff Otomatis Sepenuhnya
Tidak perlu menandai secara manual:
- Fase
- Peristiwa
- Rentang
Semua terdeteksi secara otomatis.
✔ Sangat Dapat Disesuaikan
Anda dapat menyesuaikan:
- Periode lookback
- Sensitivitas pivot
- Toleransi ATR
- Sensitivitas volume
- Elemen visual (label, kotak, garis)
✔ Performa Dioptimalkan
- Menggunakan analisis jendela geser
- Membatasi objek gambar
- Efisien untuk perdagangan real-time
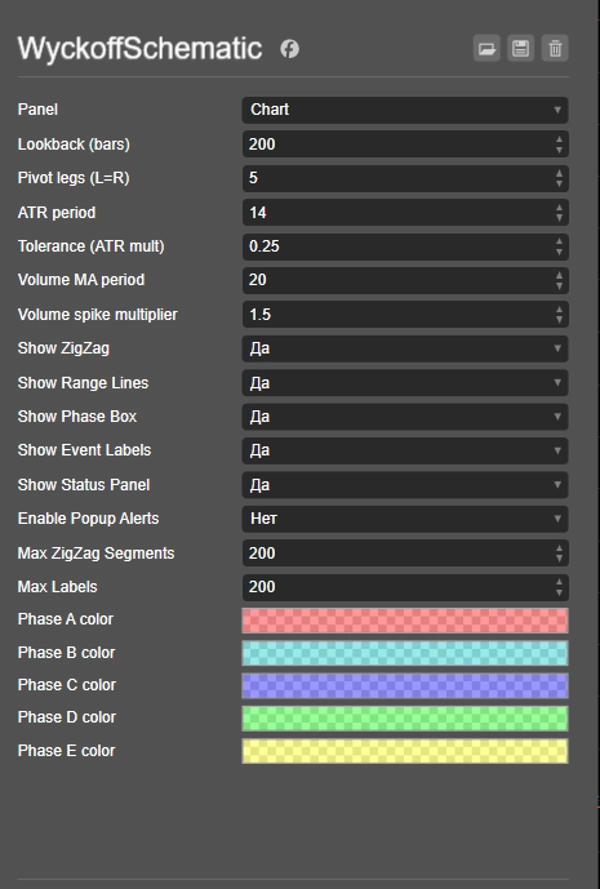
Parameter Input
Struktur & Sensitivitas
- Lookback Bars – rentang analisis
- Pivot Legs – sensitivitas deteksi ayunan
Volatilitas & Toleransi
- Periode ATR
- Pengali ATR (Toleransi)
Analisis Volume
- Periode MA Volume
- Pengali Lonjakan Volume
Visualisasi
- Tampilkan ZigZag
- Tampilkan Garis Rentang
- Tampilkan Kotak Fase
- Tampilkan Label Peristiwa
- Tampilkan Panel Status
Peringatan
- Aktifkan notifikasi popup
Cara Kerja (Disederhanakan)
- Mendeteksi pivot tinggi/rendah (struktur pasar)
- Menentukan konteks tren (tren naik / tren turun)
- Mencari lonjakan volume + kondisi struktural
- Menginisialisasi pola Wyckoff (Akumulasi/Distribusi)
- Melacak peristiwa dan fase langkah demi langkah
- Memperbarui visual grafik secara real time
Kasus Penggunaan Terbaik
- Perdagangan smart money / Wyckoff
- Perdagangan breakout
- Perdagangan rentang
- Deteksi pembalikan
- Analisis aliran pesanan institusional
Kesimpulan
The Wyckoff Schematic Indicator adalah alat analisis yang kuat yang mengubah teori Wyckoff yang kompleks menjadi sistem perdagangan yang sepenuhnya otomatis, visual, dan dapat ditindaklanjuti.
Ini memungkinkan trader untuk:
- Memahami niat pasar
- Mengidentifikasi setup dengan probabilitas tinggi
- Berdagang sesuai dengan perilaku institusional
Ringkasan
Ulasan pelanggan
5 | 100 % | |
4 | 0 % | |
3 | 0 % | |
2 | 0 % | |
1 | 0 % |


