
Deskripsi
Gann Pivot Vision adalah alat analisis inovatif yang menggabungkan level pembalikan pivot klasik dan geometri Gann, memungkinkan para trader untuk secara visual mengidentifikasi level support/resistance utama dan memprediksi pembalikan pasar dengan akurasi tinggi.
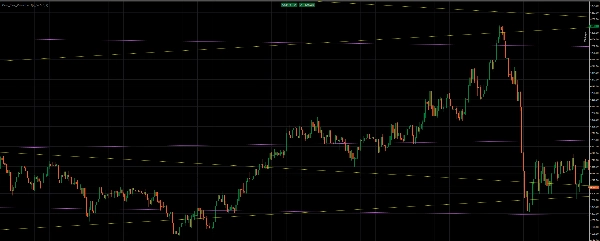
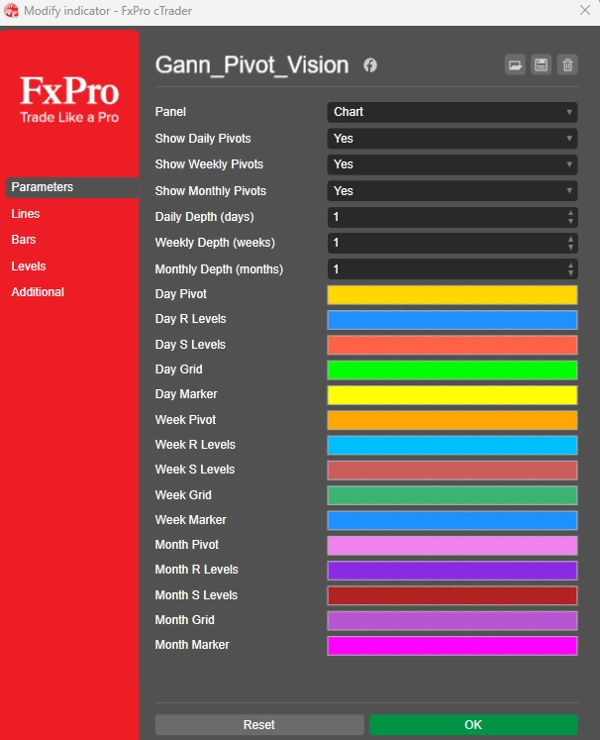
Indikator secara otomatis membangun:
✔ Level Pivot Harian
✔ Level Pivot Mingguan
✔ Level Pivot Bulanan
Setiap kerangka waktu ditampilkan dengan skema warna sendiri dan dapat diaktifkan atau dinonaktifkan jika diperlukan.
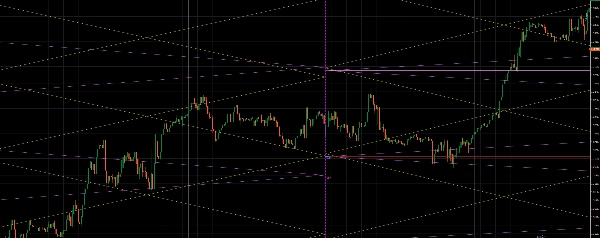
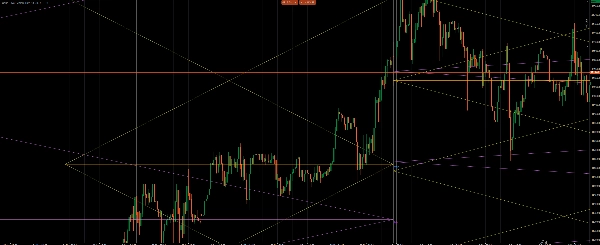
🔷 Struktur grid dan diagonal Gann
Selain itu, alat ini menghasilkan grid berlian Gann berdasarkan rentang periode sebelumnya.:
◾ Garis diagonal (simetri Gann)
◾ Persilangan geometris — area reaksi pasar utama
◾ Pusat struktur = harga tengah periode (Pivot Point)
Kombinasi ini memungkinkan Anda untuk:
🔹 mengidentifikasi klaster harga yang kuat
🔹 mengidentifikasi area pembalikan yang mungkin
🔹 mengonfirmasi sinyal tren dan kontra tren
Ringkasan
Ulasan pelanggan
5 | 0 % | |
4 | 100 % | |
3 | 0 % | |
2 | 0 % | |
1 | 0 % |


