
Market_Session_Forex
Indikator
4 pembelian
Versi 1.0, Jul 2025
Windows, Mac
4.5
Ulasan: 2
Deskripsi
Pasar Forex beroperasi 24 jam sehari melalui sesi perdagangan global yang tumpang tindih. Setiap sesi mencerminkan aktivitas pusat keuangan utama dan ditandai dengan tingkat likuiditas, volatilitas, dan volume perdagangan yang berbeda-beda.
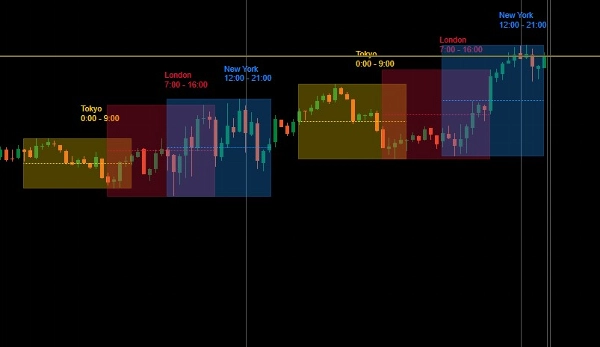
📊 Grafik menampilkan tiga sesi utama dalam blok waktu yang terkoordinasi:
🟡 Sesi Tokyo (Sesi Asia)
🔴 Sesi London (Sesi Eropa)
🔵 Sesi New York (Sesi AS)
🧩 Periode Tumpang Tindih:
- Tumpang Tindih London–New York
Periode paling aktif dalam hari perdagangan dengan volume puncak dan pergerakan harga utama.
Produk Lain Saya
- Zona FVG Institusional MTF dengan Konfluensi
- Suite Level Sesi All-in-One
- MARKET_STRUCTURE BOS_CHoCH
- Overlay Grafik Candlestick Multi_TF
- Zona Pembunuh ICT & Makro
- ICT_SMC_ToolKit
- VWAP_MTF
- Indeks Dinamis Pedagang (TDI)
- Market_Session_Forex
Ringkasan
Ringkasan AI
Market_Session_Forex is an indicator designed for forex trading that visually delineates the three primary global trading sessions on a chart: the Tokyo (Asian) session, the London (European) session, and the New York (U.S.) session. Each session is displayed in coordinated time blocks, highlighting periods of varying liquidity, volatility, and trading volume. The indicator also marks the London–New York overlap, recognized as the most active trading period with peak volume and significant price movements. This tool aids traders in identifying key market activity windows aligned with major financial centers, facilitating more informed trading decisions based on session timing.
Profil indikator
Ulasan pelanggan
4.5
Ulasan: 2
5 | 50 % | |
4 | 50 % | |
3 | 0 % | |
2 | 0 % | |
1 | 0 % |
Ulasan pelanggan
August 7, 2025
July 31, 2025
ngl, weak ideas are easier to skip and that is enough to keep testing it. It is one check, not the full trade.
Diskusi
Pertanyaan umum
Produk-produk yang tersedia melalui cTrader Store, termasuk bot trading, indikator, dan plugin, disediakan oleh pengembang pihak ketiga serta hanya ditujukan untuk akses teknis dan informasi. cTrader Store bukan broker dan tidak menyediakan saran investasi, rekomendasi pribadi, atau jaminan apa pun tentang kinerja di masa mendatang.


Harga
Sejak 22/06/2025
74
Penjualan
69
Instal gratis