
Deskripsi
🎯 PRO SNIPER [Algotrend] — Panduan Lengkap & Ulasan Profesional
📋 DAFTAR ISI
- Gambaran Umum
- Cara Kerja — Arsitektur Sinyal
- Mesin Skor Konfluensi (10 Faktor)
- Parameter — Panduan Detail untuk Setiap Pengaturan
- Auto-Presets — Tabel Perbandingan
- Sistem Penilaian (A+, A, B, C)
- Manajemen Risiko — SL, TP & Trailing
- Dashboard & Pelacak Backtest
- Tips Penggunaan Praktis
- Kekuatan & Keterbatasan
1. 🔭 GAMBARAN UMUM
Pro Sniper adalah indikator overlay multi-konfluensi yang dirancang untuk menghasilkan sinyal Long dan Short dengan keandalan tinggi. Ini tidak bergantung pada satu indikator saja — melainkan menggabungkan 10 faktor teknis berbeda menjadi skor konfluensi yang berkisar dari 0 hingga 10. Sinyal hanya muncul ketika skor melebihi ambang minimum yang dikonfigurasi.
Konsep dasarnya sederhana namun kuat: satu indikator (misalnya RSI di wilayah oversold) dapat menghasilkan sinyal palsu. Tetapi ketika RSI, MACD, EMA, VWAP, Volume, ADX, dan tren timeframe lebih tinggi semuanya menunjuk ke arah yang sama secara bersamaan, probabilitas keberhasilan perdagangan meningkat secara signifikan.
Indikator ini juga mencakup sistem manajemen perdagangan lengkap dengan 3 level Take Profit, Stop Loss struktural, dan trailing stop otomatis, plus pelacak backtest bawaan yang menampilkan statistik kinerja historis secara real time.
2. ⚙️ CARA KERJA — ARSITEKTUR SINYAL
Sinyal Pro Sniper lahir dari konvergensi 6 kondisi simultan:
Kondisi 1 — EMA Crossover 🔀 EMA Cepat harus melintasi EMA Lambat. Persilangan ke atas = kandidat Long, persilangan ke bawah = kandidat Short. Tanpa persilangan ini, tidak ada sinyal yang bisa muncul. Ini adalah "pemicu" fundamental.
Kondisi 2 — Momentum 📈 Untuk Long, harga harus di atas EMA Cepat dan EMA Lambat. Untuk Short, di bawah keduanya. Ini menyaring persilangan palsu di mana harga "terperangkap" di antara dua rata-rata bergerak.
Kondisi 3 — Filter RSI 📊 RSI tidak boleh berada di zona ekstrem: untuk Long harus di bawah 75 (tidak overbought), untuk Short di atas 25 (tidak oversold). Ini mencegah entri saat momentum sudah habis.
Kondisi 4 — Skor Minimum 🏆 Skor konfluensi (0 sampai 10, dihitung dari 10 faktor) harus mencapai ambang minimum yang dikonfigurasi. Dengan preset Default, minimal 5/10 diperlukan.
Kondisi 5 — Filter Grade 🏅 Sinyal harus melewati filter kualitas yang dipilih (Semua, A+/A, atau Hanya A+).
Kondisi 6 — Arah 🚫 Sinyal berturut-turut dalam arah yang sama tidak dihasilkan. Setelah Long, sinyal berikutnya hanya bisa Short (atau Long baru setelah SL terkena dan arah direset).
3. 🧮 MESIN SKOR KONFLUENSI
Inti dari indikator ini adalah mesin skornya. Untuk setiap bar, dihitung bullScore dan bearScore, masing-masing terdiri dari 10 faktor:
Untuk Sinyal LONG (Skor Bull):
#FaktorKondisiBobot
1
📈 Arah EMA
EMA Cepat > EMA Lambat
+1.0
2
📊 Tren Makro
Harga > EMA Tren (periode panjang)
+1.0
3
💪 Momentum RSI
RSI antara 50 dan 75 (momentum positif, belum habis)
+1.0
4
📉 Histogram MACD
Histogram MACD > 0
+1.0
5
🔀 Persilangan MACD
Garis MACD > Garis Sinyal
+1.0
6
⚖️ Posisi VWAP
Harga > VWAP (di atas harga rata-rata tertimbang volume)
+1.0
7
📦 Volume
Volume saat ini > SMA(20) × 1.2 (volume di atas rata-rata)
+1.0
8
🎯 ADX + DI
ADX > 20 dan DI+ > DI- (tren kuat ke arah yang benar)
+1.0
9
🌐 Bias HTF
EMA Cepat > EMA Lambat pada timeframe lebih tinggi
+1.5
10
✨ Harga vs Cepat
Harga > EMA Cepat (konfirmasi tambahan)
+0.5
Skor teoretis maksimum: 10,0 poin
Bobot tidak sama untuk semua faktor. Bias timeframe lebih tinggi (HTF) bernilai 1,5 poin karena merupakan filter paling penting: berdagang melawan tren makro adalah penyebab utama kerugian. Faktor "Harga vs EMA Cepat" hanya bernilai 0,5 karena merupakan konfirmasi minor.
Untuk sinyal SHORT (Skor Bear), logikanya dibalik: EMA Cepat < Lambat, harga di bawah EMA Tren, RSI antara 25 dan 50, MACD negatif, dll.
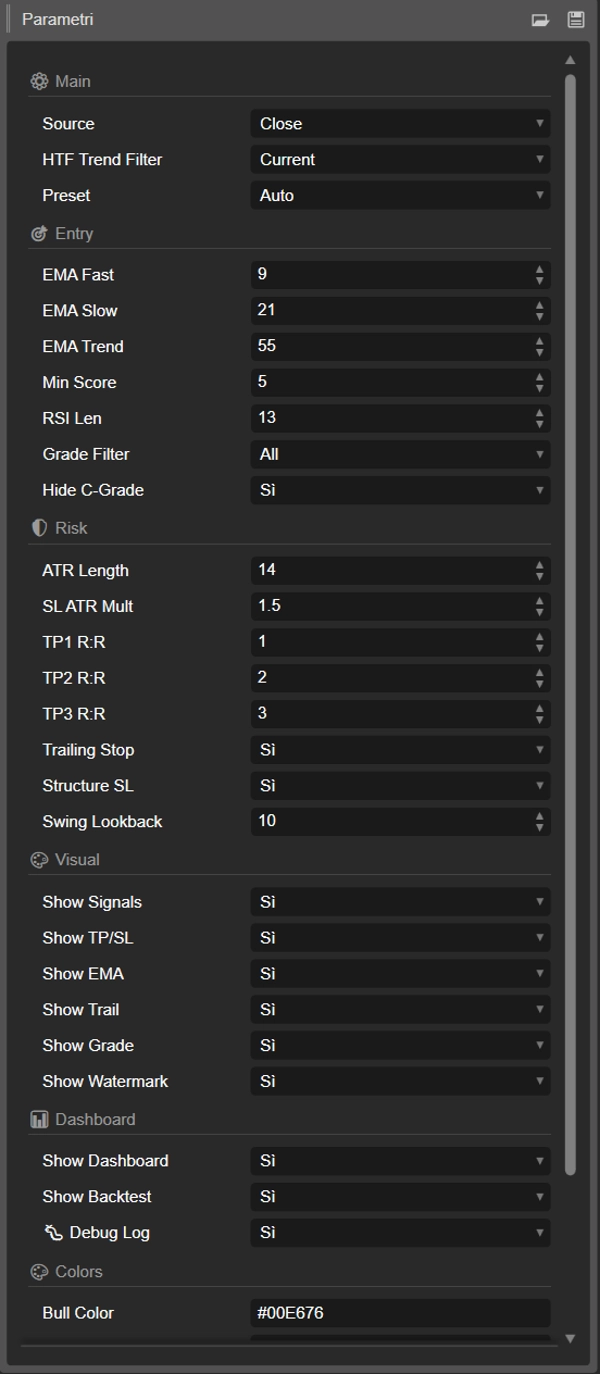
4. 📖 PARAMETER — PANDUAN DETAIL
⚙️ GRUP: Pengaturan Utama
🔹 Sumber (Default: Close) Seri harga yang digunakan untuk semua perhitungan (EMA, RSI, MACD). Pilihan: Close, Open, High, Low, Median (HL/2), Typical (HLC/3), Weighted ((H+L+2C)/4). Dalam sebagian besar kasus, Close adalah pilihan terbaik. Typical berguna pada instrumen sangat volatil karena sedikit meratakan data.
🔹 Filter Tren HTF (Default: Current) Timeframe lebih tinggi yang digunakan untuk menghitung bias tren makro. Jika disetel ke "Current," menggunakan timeframe yang sama dengan grafik. Konfigurasi yang direkomendasikan: jika Anda berdagang di M5-M15 gunakan H1, jika di H1 gunakan H4, jika di H4 gunakan Daily. Filter ini bernilai 1,5 poin dalam skor dan dirancang untuk mencegah perdagangan melawan tren dominan. Data HTF menggunakan bar terkonfirmasi sebelumnya untuk menghindari repainting.
🔹 Preset (Default: Auto) Memilih profil yang sudah dikonfigurasi sebelumnya yang secara otomatis mengatur semua parameter di grup Entry dan Risk. Dengan "Auto," preset dipilih berdasarkan timeframe grafik: M1-M5 → Scalping, M6-H1 → Default, H2-H4 → Aggressive, D1+ → Swing. Memilih "Custom" memungkinkan Anda mengubah setiap parameter secara manual.
🎯 GRUP: Mesin Entry
🔹 EMA Cepat (Default: 9 | Rentang: 3-50) Periode rata-rata bergerak eksponensial cepat. Nilai lebih rendah (5-8) membuatnya lebih responsif terhadap pergerakan harga, menghasilkan persilangan lebih sering tapi dengan lebih banyak noise. Nilai lebih tinggi (12-15) membuatnya lebih lambat tapi sinyal lebih dapat diandalkan. Diabaikan oleh preset yang dipilih (kecuali "Custom"). Nilai per preset: Scalping=5, Aggressive=8, Default=9, Conservative=12, Swing=13.
🔹 EMA Lambat (Default: 21 | Rentang: 10-100) Periode EMA lambat. Bersama EMA Cepat membentuk "pita" yang terlihat di grafik. Persilangan antara Cepat dan Lambat adalah pemicu fundamental untuk setiap sinyal. Jarak antara dua periode memengaruhi frekuensi persilangan: periode lebih dekat (misal 9/18) menghasilkan lebih banyak sinyal; periode lebih lebar (misal 13/34) menghasilkan sinyal lebih sedikit tapi pada pergerakan lebih signifikan. Nilai per preset: Scalping=13, Aggressive=18, Default=21, Conservative=26, Swing=34.
🔹 EMA Tren (Default: 55 | Rentang: 20-200) EMA periode panjang yang menentukan tren makro. Harga di atas EMA ini menunjukkan konteks bullish, di bawah menunjukkan bearish. Digambar di grafik sebagai garis abu-abu putus-putus. Nilai tipikal adalah 50, 55, 89 (angka Fibonacci), 100, atau 200. Nilai per preset: Scalping=34, Default=55, Conservative/Swing=89.
🔹 Skor Min (Default: 5 | Rentang: 1-10) Ambang konfluensi minimum yang diperlukan untuk menghasilkan sinyal. Ini adalah parameter paling berpengaruh pada seluruh indikator. Nilai 3 menghasilkan banyak sinyal (lebih banyak perdagangan, lebih banyak noise). Nilai 7 menghasilkan sangat sedikit sinyal tapi sangat tersaring. Hubungannya tidak linier: naik dari 5 ke 7 dapat mengurangi sinyal sebesar 70-80%. Nilai per preset: Scalping=4, Aggressive=3, Default=5, Swing=6, Conservative=7.
🔹 Panjang RSI (Default: 13 | Rentang: 5-30) Periode Relative Strength Index. Periode lebih pendek (8-10) membuat RSI lebih sensitif dan responsif, berguna untuk scalping. Periode lebih panjang (14-21) membuatnya lebih stabil, cocok untuk swing trading. RSI tidak digunakan sebagai sinyal langsung tapi memberikan +1.0 ke skor jika berada di zona yang tepat (50-75 untuk Long, 25-50 untuk Short) dan berfungsi sebagai filter (menghalangi Long jika RSI > 75, menghalangi Short jika RSI < 25).
🔹 Filter Grade (Default: Semua) Menyaring sinyal berdasarkan grade kualitas (lihat bagian Penilaian). "Semua" menampilkan semua sinyal valid. "A+ dan A" hanya menampilkan sinyal dengan skor ≥ 6,5. "Hanya A+" hanya menampilkan sinyal dengan skor ≥ 8,0. Filter ini diterapkan DI ATAS Skor Min. Contoh: jika menggunakan preset Aggressive (minScore=3) dengan Filter Grade "Hanya A+", sinyal dengan skor 3-7,9 tetap akan disaring.
🔹 Sembunyikan Grade C (Default: true) Saat diaktifkan, menyembunyikan sinyal dengan skor < 5,0 (grade C). Berguna dengan preset ambang rendah (Aggressive, Scalping) untuk menghindari sinyal berkualitas rendah. Tidak berpengaruh saat Filter Grade sudah diatur ke "A+" atau "A+ dan A" karena ambang tersebut sudah di atas 5,0.
🛡️ GRUP: Manajemen Risiko
🔹 Panjang ATR (Default: 14 | Rentang: 5-50) Periode Average True Range, yang mengukur volatilitas rata-rata instrumen. Digunakan untuk menghitung jarak Stop Loss dan secara tidak langsung level Take Profit. ATR 14 periode adalah standar industri. Nilai lebih pendek (10) bereaksi lebih cepat terhadap perubahan volatilitas. Nilai per preset: Scalping=10, Default=14, Swing/Crypto=20.
🔹 SL ATR Mult (Default: 1,5 | Rentang: 0,5-5,0) Pengali ATR untuk perhitungan Stop Loss. SL ditempatkan pada jarak = ATR × nilai ini dari entry. Contoh: jika ATR = 100 pips dan pengali 1,5, SL adalah 150 pips dari entry. Nilai lebih ketat (0,8-1,2) memberikan risiko lebih kecil per perdagangan tapi lebih sering terkena stop out. Nilai lebih lebar (2,0-3,0) memberi ruang lebih untuk perdagangan tapi risiko lebih tinggi. Nilai per preset: Scalping=0,8, Aggressive=1,2, Default=1,5, Conservative=2,0, Swing=2,5.
🔹 TP1 R:R (Default: 1,0 | Rentang: 0,5-5,0) Level Take Profit pertama, dinyatakan sebagai kelipatan risiko. Dengan TP1=1,0, target berada pada jarak sama dengan SL dari entry (rasio risiko-imbalan 1:1). Jika SL 150 pips, TP1 adalah keuntungan 150 pips. Ini adalah target "ambil keuntungan parsial" — yang paling mungkin tercapai.
🔹 TP2 R:R (Default: 2,0 | Rentang: 1,0-8,0) Take Profit kedua. Dengan TP2=2,0, target dua kali jarak SL. Titik bagus untuk menutup sebagian posisi lagi. Jika trailing aktif, saat mencapai TP2 stop dipindahkan ke level TP1 (mengunci keuntungan).
🔹 TP3 R:R (Default: 3,0 | Rentang: 1,5-12,0) Take Profit ketiga dan terakhir — "runner." Dengan TP3=3,0, target tiga kali jarak SL. Mencapai TP3 lebih jarang tapi sangat menguntungkan. Mewakili perdagangan yang "lari" jauh ke arah yang benar.
🔹 Trailing Stop (Default: true) 🔄 Saat aktif, SL secara progresif dipindahkan saat TP tercapai: setelah TP1 → SL pindah ke breakeven (harga entry). Setelah TP2 → SL pindah ke level TP1. Setelah TP3 → SL pindah ke level TP2. Mekanisme ini "mengunci" keuntungan dan mengubah sebagian perdagangan menjadi operasi tanpa risiko. Sangat disarankan untuk tetap aktif.
🔹 Struktur SL (Default: true) 🏗️ Saat aktif, Stop Loss ditempatkan di bawah/atas swing low/high terbaru bukan pada jarak ATR murni. Penempatan ini lebih realistis karena SL berada di belakang level support/resistance struktural. Indikator memilih antara stop ATR dan stop struktural yang lebih menguntungkan (lebih ketat), dengan jarak minimum dijamin 0,5×ATR untuk mencegah stop terlalu ketat.
🔹 Swing Lookback (Default: 10 | Rentang: 3-30) Jumlah bar yang dilihat ke belakang untuk swing low/high terbaru, digunakan oleh Struktur SL. Dengan 10, indikator mencari minimum/maksimum dari 10 bar terakhir. Nilai lebih tinggi (15-20) menemukan level struktural lebih signifikan tapi mungkin lebih jauh, meningkatkan risiko per perdagangan.
🎨 GRUP: Pengaturan Visual
🔹 Tampilkan Sinyal (Default: true) — Menampilkan/menyembunyikan panah dan label "Long"/"Short" di grafik.
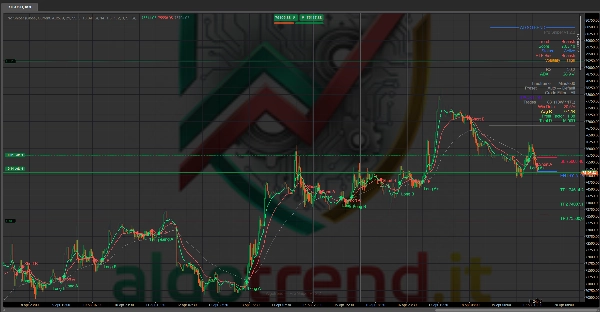
🔹 Tampilkan TP/SL (Default: true) — Menampilkan/menyembunyikan garis horizontal untuk Entry (biru), Stop Loss (merah), TP1/TP2/TP3 (hijau putus-putus), dan teks terkait. Level yang tercapai berubah warna menjadi teal dengan tanda centang ✓.
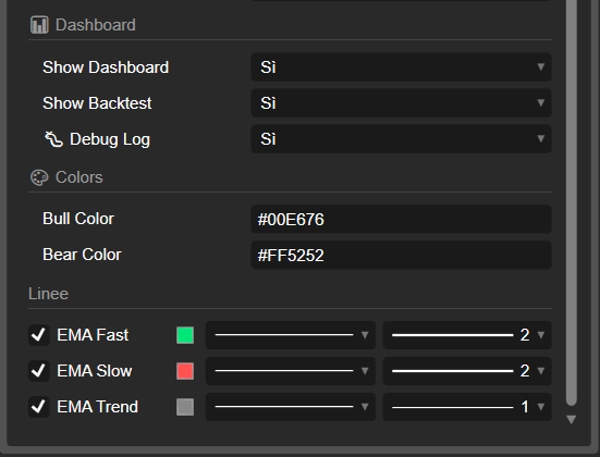
🔹 Tampilkan EMA (Default: true) — Menampilkan/menyembunyikan tiga garis EMA (Cepat=hijau, Lambat=merah, Tren=abu-abu putus-putus).
🔹 Tampilkan Trail (Default: true) — Menampilkan/menyembunyikan garis trailing stop (oranye, putus-putus) saat trailing aktif dan telah bergeser dari level SL asli.
🔹 Tampilkan Grade (Default: true) — Menambahkan grade kualitas (A+, A, B, C) pada label sinyal. Contoh: "Long A+" atau "Short B."
🔹 Tampilkan Watermark (Default: true) — Menampilkan teks "Algotrend — ProSniper v1.2.2" di tengah bawah grafik.
📊 GRUP: Dashboard
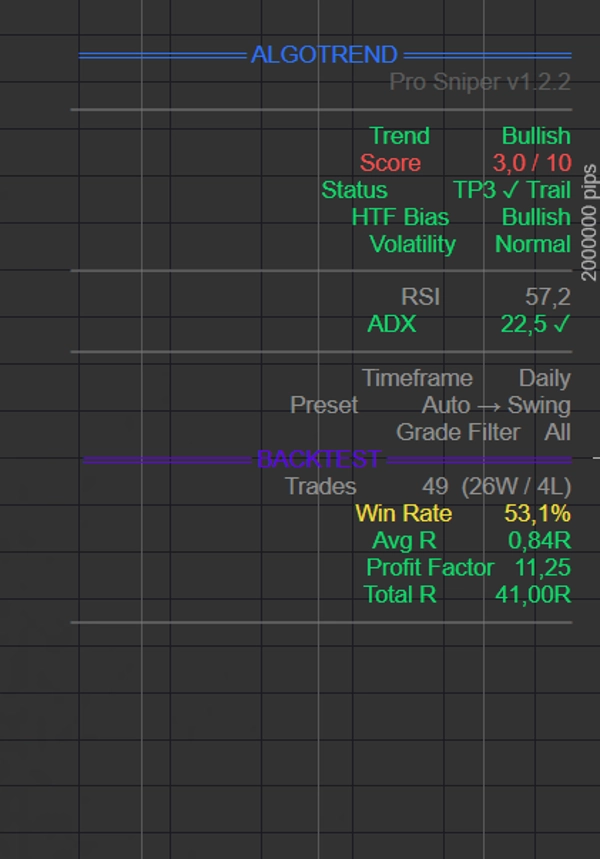
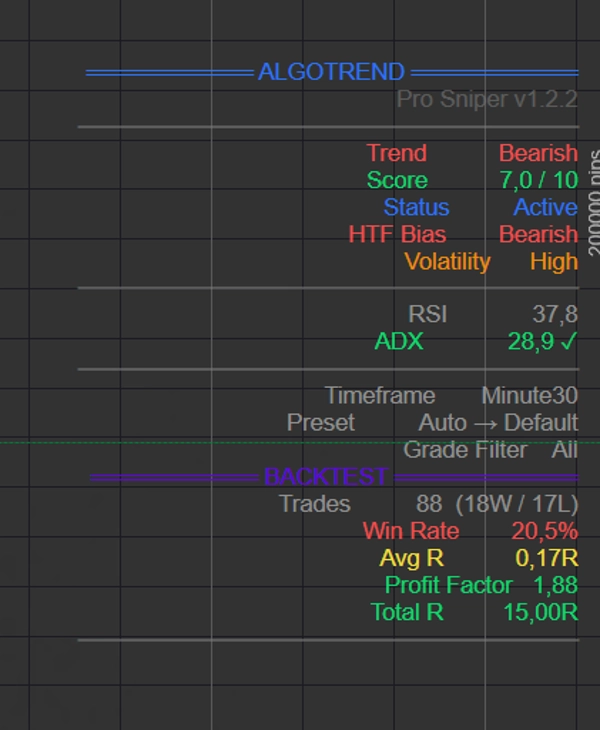
🔹 Tampilkan Dashboard (Default: true) — Menampilkan panel informasi di sudut kanan atas dengan: Tren saat ini, Skor, Status Perdagangan, Bias HTF, Volatilitas, RSI, ADX, Timeframe, Preset aktif, Filter Grade, dan Versi.
🔹 Tampilkan Backtest (Default: true) — Menampilkan panel statistik di bawah dashboard. Termasuk: total perdagangan tertutup (Menang/Kalah), persentase Win Rate, R rata-rata (rata-rata pengembalian per perdagangan), Faktor Profit (rasio keuntungan/kerugian), dan Total R kumulatif. Warna panel berubah dinamis: 🟢 hijau jika Total R positif (laba bersih), 🔴 merah jika negatif (rugi bersih), 🟡 kuning di titik impas, ⚪ abu-abu tanpa perdagangan.
🔹 Log Debug (Default: false) 🐛 — Mengaktifkan pencatatan diagnostik di konsol Log cTrader. Berguna untuk pemecahan masalah: menampilkan setiap persilangan EMA yang terdeteksi dengan detail kondisi lengkap (skor, momentum, RSI, grade, arah), setiap sinyal yang dihasilkan, dan ringkasan akhir. Harus dinonaktifkan saat penggunaan normal agar log tidak penuh.
🎨 GRUP: Warna
🔹 Warna Bull (Default: #00E676) — Warna untuk sinyal Long, EMA Cepat, dan panah bullish. Hijau cerah yang terlihat di latar gelap.
🔹 Warna Bear (Default: #FF5252) — Warna untuk sinyal Short, EMA Lambat, dan panah bearish. Merah karang yang terlihat di latar gelap.
5. 📊 PRESET — TABEL PERBANDINGAN
Setiap preset secara otomatis mengonfigurasi 7 parameter. Berikut perbandingan lengkapnya:
Parameter🏎️ Scalping⚡ Agresif⚖️ Default🛡️ Konservatif📅 Swing🌐 Crypto 24/7
EMA Cepat
5
8
9
12
13
9
EMA Lambat
13
18
21
26
34
21
EMA Tren
34
50
55
89
89
55
Panjang RSI
8
11
13
14
21
14
Panjang ATR
10
12
14
14
20
20
Skor Min
4
3
5
7
6
5
SL Mult
0,8×
1,2×
1,5×
2,0×
2,5×
2,0×
Kapan menggunakan preset mana:
🏎️ Scalping — Timeframe M1-M5. Sinyal cepat, stop ketat, banyak perdagangan. Membutuhkan perhatian konstan dan spread rendah. Ideal untuk indeks dan forex mayor di M1-M5.
⚡ Agresif — Timeframe M5-M30. Banyak sinyal (minScore=3), cocok untuk yang ingin lebih banyak peluang dan menyaring secara manual. Risiko: lebih banyak sinyal palsu.
⚖️ Default — Timeframe M15-H1. Seimbang antara frekuensi dan keandalan. Titik awal yang direkomendasikan untuk sebagian besar trader.
🛡️ Konservatif — Timeframe H1-H4. Sangat sedikit sinyal (minScore=7), tapi berkualitas tinggi. Stop lebar memberi ruang lebih. Ideal untuk yang tidak bisa memantau grafik terus-menerus.
📅 Swing — Timeframe H4-D1. Dirancang untuk perdagangan yang berlangsung berhari-hari. EMA lambat (13/34/89), stop sangat lebar (2,5×ATR). Sedikit sinyal per minggu.
🌐 Crypto 24/7 — Seperti Default tapi dengan ATR dan SL lebih lebar untuk menangani volatilitas 24 jam pasar kripto. Tanpa bias sesi.
6. 🏅 SISTEM PENILAIAN
Setiap sinyal menerima grade berdasarkan skor konfluensinya:
GradeSkor DiperlukanMakna
🥇 A+
≥ 8,0 / 10
Luar biasa — konfluensi maksimum, semua indikator selaras
🥈 A
≥ 6,5 / 10
Baik — sebagian besar faktor mengonfirmasi perdagangan
🥉 B
≥ 5,0 / 10
Rata-rata — konfluensi cukup tapi tidak kuat
❌ C
< 5,0 / 10
Lemah — banyak faktor tidak mengonfirmasi, risiko tinggi
Grade ditampilkan di samping sinyal di grafik (misal "Long A+" atau "Short B") dan dapat digunakan untuk menyaring sinyal melalui Filter Grade.
Sinyal A+ pada timeframe H1 dengan preset Default berarti setidaknya 8 dari 10 faktor menunjuk ke arah yang sama, termasuk bias HTF (1,5 poin). Jenis setup ini jarang tapi secara historis memiliki tingkat keberhasilan sangat tinggi.
7. 🛡️ MANAJEMEN RISIKO — CARA KERJA DETAIL
Perhitungan Stop Loss
Saat sinyal muncul, SL dihitung dengan dua cara (jika Struktur SL diaktifkan):
- Stop ATR: Entry ± (ATR × Multiplier SL). Contoh: Entry=100, ATR=2, Mult=1,5 → SL Long = 97,0
- Stop Struktur: Swing Low Terbaru − 0,2×ATR (untuk Long) atau Swing High + 0,2×ATR (untuk Short). Buffer 0,2×ATR mencegah SL tepat di level struktural (tempat sering terjadi perburuan stop).
Indikator memilih level yang lebih menguntungkan (lebih ketat) antara keduanya, dengan jarak minimum dijamin 0,5×ATR.
Perhitungan Take Profit
TP dihitung sebagai kelipatan risiko (jarak Entry ke SL):
Risiko = |Entry − SL| TP1 = Entry ± Risiko × TP1_Multiplier TP2 = Entry ± Risiko × TP2_Multiplier TP3 = Entry ± Risiko × TP3_Multiplier
Trailing Stop — Urutan
Dengan trailing aktif, progresinya: SL Asli → TP1 tercapai → SL pindah ke breakeven → TP2 tercapai → SL pindah ke TP1 → TP3 tercapai → SL pindah ke TP2. Jika harga mundur setelah TP2 dan menyentuh TP1 (level trailing baru), perdagangan ditutup dengan keuntungan sama dengan TP1 bukan kerugian.
Cara Perdagangan Ditutup dalam Backtest
Perdagangan ditutup saat: SL (atau trailing stop) terkena, atau sinyal berlawanan muncul. Hasil dalam "R" tergantung berapa banyak TP yang tercapai sebelum penutupan. Dengan trailing aktif, jika SL terkena setelah TP2, pengembalian yang dicatat adalah TP1 (karena trail diparkir di sana), bukan TP2.
8. 📊 DASHBOARD — MEMBACA DATA
Panel Utama
BidangMakna
Tren
Bullish (EMA Cepat > Lambat DAN harga > EMA Tren), Bearish (sebaliknya), atau Netral
Skor
Skor konfluensi saat ini (dari perdagangan terbuka, atau skor bull/bear maksimum)
Status
"No Trade", "Active", "TP1 ✓ Trail", "TP2 ✓ Trail", "TP3 ✓ Trail"
Bias HTF
Arah tren pada timeframe lebih tinggi
Volatilitas
"Tinggi" (ATR > 1,3× rata-rata), "Normal", "Rendah" (ATR < 0,7× rata-rata)
RSI
Nilai RSI saat ini
ADX
Nilai ADX saat ini. ✓ = tren kuat (> 20)
Timeframe
Timeframe grafik saat ini
Preset
Preset aktif. Jika Auto, menampilkan "Auto → [preset terpilih]"
Filter Grade
Filter grade aktif
Versi
v1.2.2
Panel Backtest (berkode warna)
BidangMakna
Perdagangan
Total perdagangan tertutup (Menang / Kalah)
Win Rate
Persentase perdagangan menang (setidaknya TP1 tercapai)
Rata-rata R
Rata-rata pengembalian per perdagangan dalam satuan risiko. > 0,5R = baik
Faktor Profit
Jumlah keuntungan / Jumlah kerugian. > 1,5 = baik, > 2,0 = sangat baik
Total R
Total pengembalian kumulatif dalam satuan risiko
9. 💡 TIPS PENGGUNAAN PRAKTIS
🔹 Mulailah dengan preset Default pada timeframe M15 atau H1. Ini adalah titik awal yang paling seimbang.
🔹 Atur Filter Tren HTF satu level di atas timeframe operasi Anda: M15 → H1, H1 → H4, H4 → Daily. Bias HTF bernilai 1,5 poin dan membuat perbedaan besar dalam kualitas sinyal.
🔹 Jangan turunkan Skor Min di bawah 4 tanpa alasan yang kuat. Sinyal di bawah 4/10 memiliki konfluensi yang tidak cukup.
🔹 Gunakan Filter Grade "A+ dan A" jika Anda mengutamakan kualitas daripada kuantitas. Anda akan mendapatkan lebih sedikit sinyal tapi setiap perdagangan memiliki setidaknya 6-7 faktor yang selaras.
🔹 Pertahankan Trailing Stop aktif. Ini secara sistematis mengubah perdagangan yang menang menjadi operasi tanpa risiko setelah TP1.
🔹 Periksa Backtest sebelum berdagang. Jika panel berwarna merah pada instrumen/timeframe Anda, pertimbangkan untuk mengganti preset atau timeframe sebelum mempertaruhkan modal nyata.
🔹 Di pasar ranging (ADX < 20, Volatilitas "Rendah"), sinyal kurang dapat diandalkan. ADX di dashboard memberi tahu Anda ini secara real time.
🔹 Untuk Crypto, gunakan preset "Crypto 24/7" yang memiliki stop lebih lebar untuk menangani gap dan volatilitas semalam.
🔹 Log Debug berguna jika sinyal yang diharapkan tidak muncul. Aktifkan, muat ulang grafik, dan periksa di Log kondisi mana yang memblokir sinyal.
10. ⚖️ KEKUATAN & KETERBATASAN
✅ Kekuatan
Multi-konfluensi sejati — 10 faktor independen, bukan hanya indikator yang tumpang tindih. Setiap faktor menangkap aspek berbeda dari pasar (tren, momentum, volume, volatilitas, timeframe lebih tinggi).
Preset cerdas — Sistem Auto memilih parameter optimal untuk timeframe, menghilangkan kebutuhan optimasi manual bagi sebagian besar pengguna.
Manajemen risiko terintegrasi — SL struktural + trailing otomatis + 3 level TP menawarkan manajemen perdagangan profesional tanpa alat eksternal.
Backtest real-time — Anda dapat langsung mengevaluasi apakah indikator bekerja pada instrumen Anda sebelum mempertaruhkan modal.
HTF tanpa repainting — Bias timeframe lebih tinggi menggunakan bar terkonfirmasi sebelumnya, mencegah sinyal yang berubah secara retroaktif.
Penilaian transparan — Anda dapat melihat dengan tepat mengapa sinyal A+ atau B dengan melihat skor dan faktor di dashboard.
⚠️ Keterbatasan
Bukan sistem otomatis — Ini adalah indikator, bukan bot. Sinyal harus dikonfirmasi secara visual oleh trader. Tidak membuka atau menutup perdagangan.
Backtest sederhana — Mengasumsikan entri pada penutupan bar dan tidak memperhitungkan slippage, komisi, atau spread. Hasil nyata akan sedikit lebih buruk.
VWAP perkiraan — Di cTrader, VWAP dihitung menggunakan Tick Volume (bukan volume nyata), membuatnya kurang akurat pada instrumen OTC seperti Forex.
Kurang optimal di pasar ranging — Seperti semua indikator berbasis persilangan EMA, menghasilkan sinyal palsu di pasar tanpa tren, sideways.
Trailing dapat membatasi keuntungan — Dalam tren sangat kuat, trailing stop dapat menutup perdagangan terlalu dini. Tanpa trailing, perdagangan yang mencapai TP3 mencatat +3R; dengan trailing, jika SL terkena setelah TP3, pengembalian yang dicatat adalah +2R (karena trail diparkir di TP2).
📌 Dokumen dibuat untuk Pro Sniper v1.2.2 — Port cTrader Terakhir diperbarui: April 2026
Ringkasan
Key features include:
- Signal architecture based on six conditions including EMA crossover, momentum filters, RSI limits, minimum confluence score, quality grading, and directional control to avoid consecutive same-direction signals.
- A confluence scoring engine that weights factors differently, with higher importance on higher-timeframe bias.
- Integrated trade management with three configurable Take Profit levels, structural Stop Loss placement considering recent swing points, and automatic trailing stops to lock in profits.
- Multiple presets tailored for various trading styles and timeframes, from scalping (M1-M5) to swing trading (H4-D1) and a crypto-specific preset for 24/7 markets.
- A dashboard displaying real-time trend, score, trade status, volatility, RSI, ADX, and backtest statistics including win rate and profit factor.
- Visual customization options for signals, EMAs, stops, and grading labels.
The indicator does not automate trade execution but provides comprehensive signals and risk management tools for manual trading decisions. It supports trend analysis and risk control across multiple markets and timeframes.
Ulasan pelanggan
5 | 0 % | |
4 | 100 % | |
3 | 0 % | |
2 | 0 % | |
1 | 0 % |


