
Deskripsi
Memperkenalkan indikator Standard Deviation Channel untuk cTrader, alat yang kuat yang dirancang untuk membantu Anda memvisualisasikan tren pasar dengan presisi.
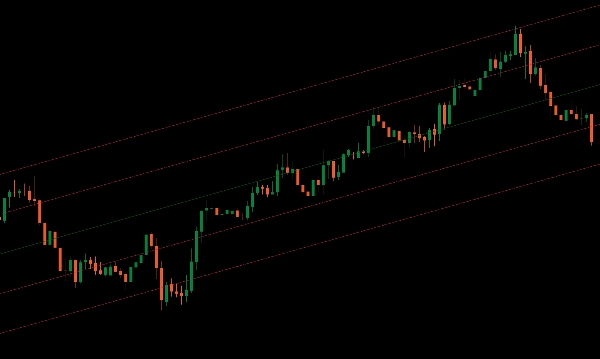
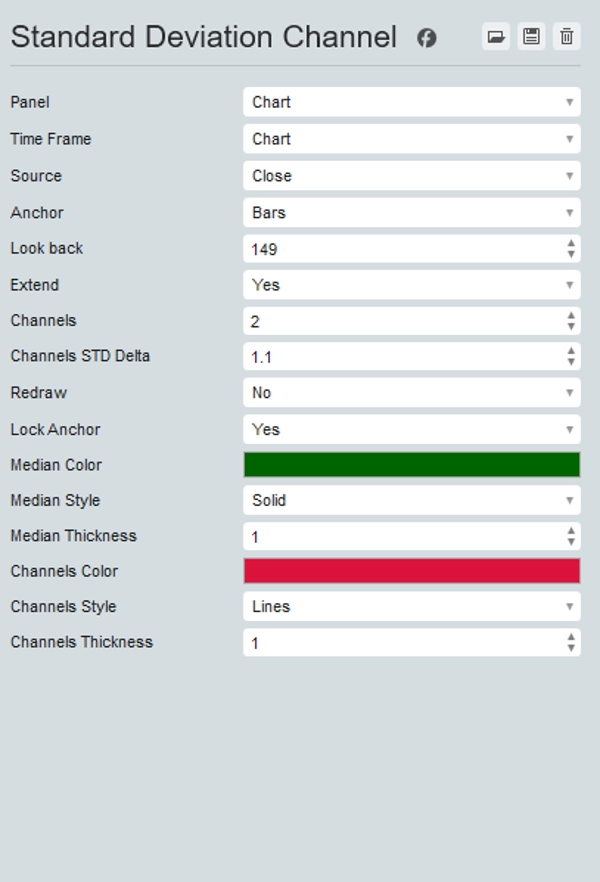
Indikator ini menampilkan median dari periode tertentu pada grafik Anda, memberikan titik referensi pusat untuk pergerakan harga.
Selain itu, ini memungkinkan Anda menambahkan sejumlah saluran atas dan bawah pada kelipatan standar deviasi, memberi Anda pandangan yang jelas tentang volatilitas harga dan zona breakout potensial.
Sempurna untuk trader yang mencari kemampuan analisis yang lebih baik, indikator Standard Deviation Channel membantu Anda mengidentifikasi arah tren dan titik pembalikan potensial dengan mudah.
Tingkatkan alat perdagangan Anda dengan Standard Deviation Channel untuk analisis pasar dan pengambilan keputusan yang lebih unggul.
Ringkasan
Ulasan pelanggan
5 | 100 % | |
4 | 0 % | |
3 | 0 % | |
2 | 0 % | |
1 | 0 % |


